What's new in SimWrapper 4.3

Announcing the release of SimWrapper 4.3, available now on pip, at https://simwrapper.app, and on GitHub.
In addition to tons of bugfixes, there are lots of new things to share:
Python "simwrapper run" tool learned some new tricks
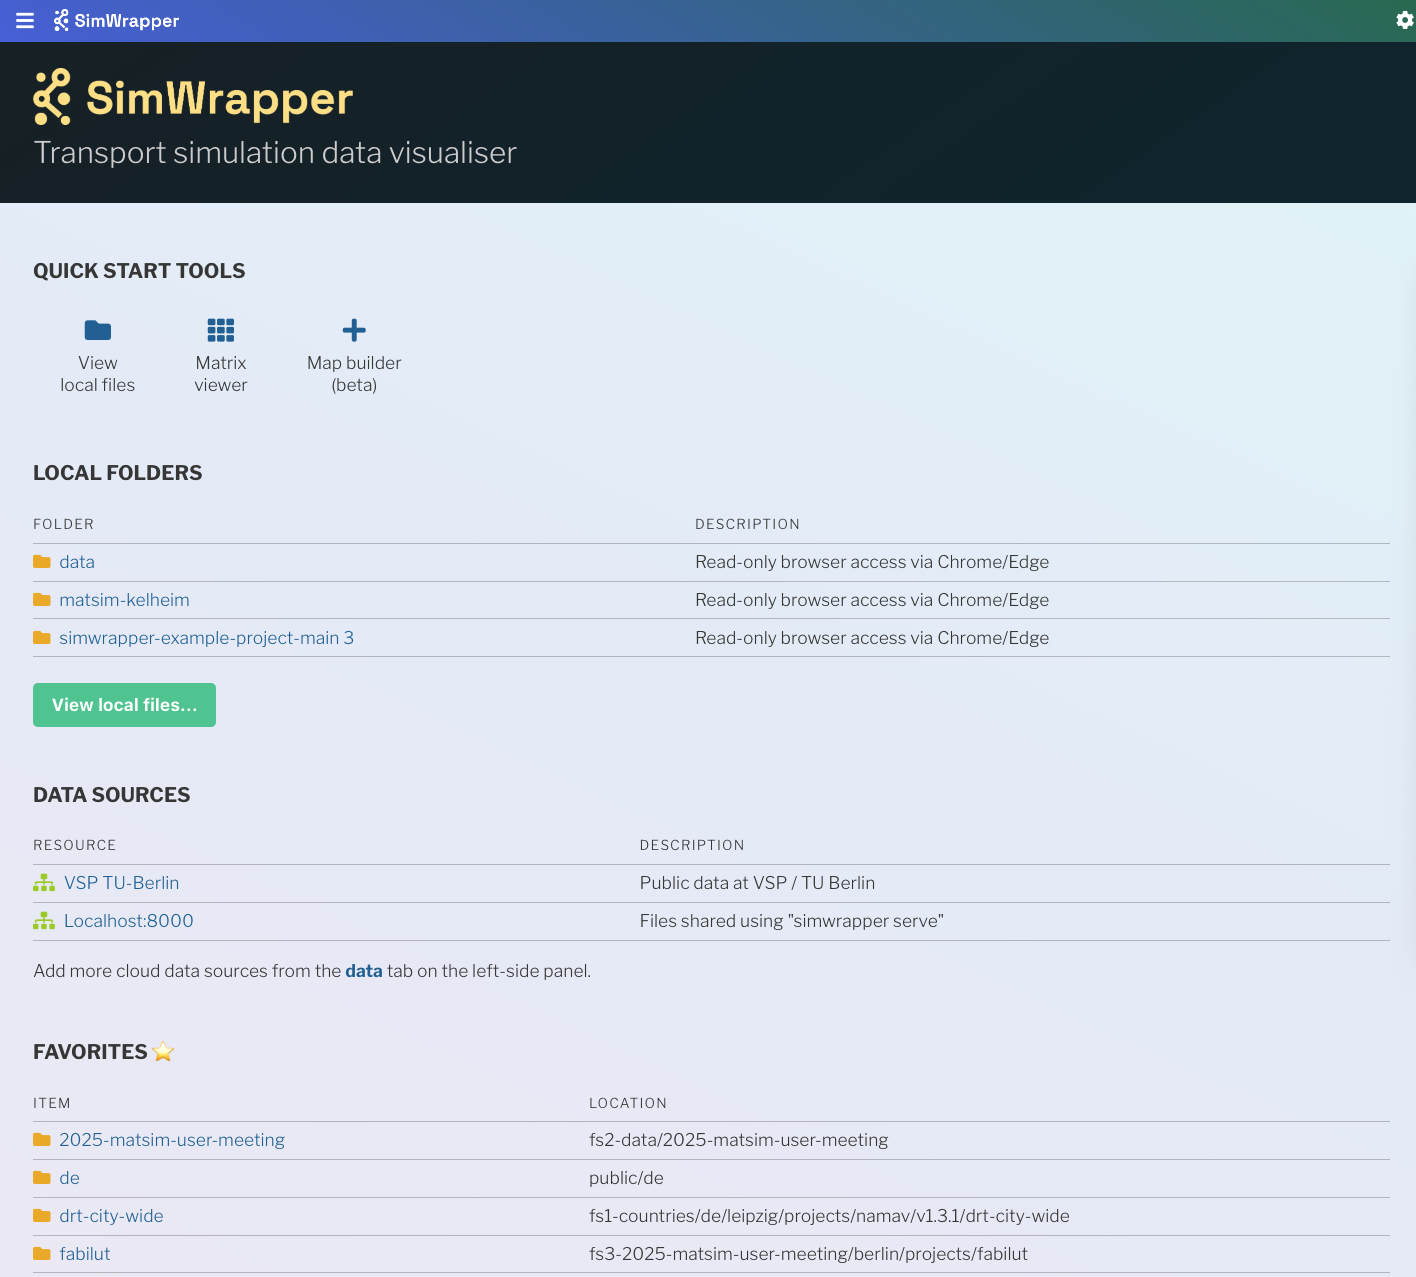
To run SimWrapper locally on your machine or network, the easiest way since version 4.0 has been to install the Python "uv" tool and then run uv tool install simwrapper. This installs a fully self-contained copy of the SimWrapper website on your machine, and you can then run the simwrapper command from any folder to view and share the files from there:
simwrapper run
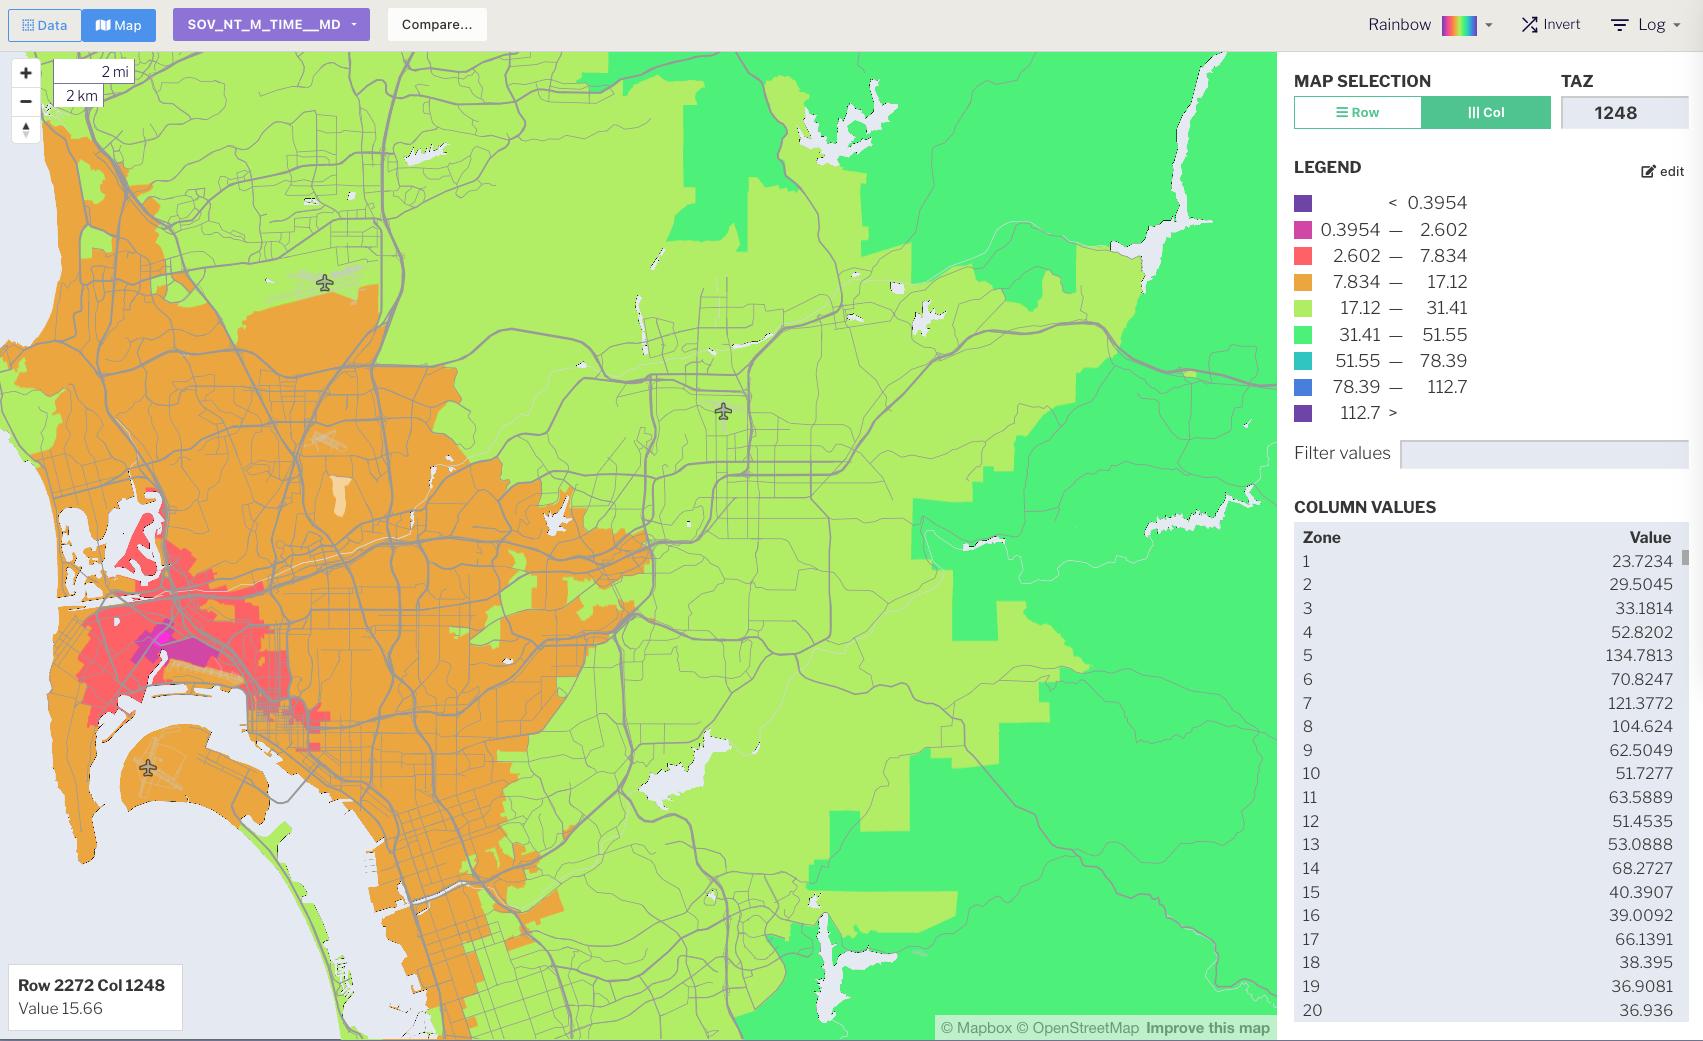
You can also provide a configuration file which defines multiple share locations instead of sharing the current working directory. This is especially useful if you have network drives! And you can specify your usual TAZ/zonal boundary files too, so that OMX matrix files can be opened in the map view automatically.
simwrapper run config.yaml
Example simwrapper config.yaml
storage:
    C-Drive:
        path: "C:/data/model-runs"
        description: "C: Drive model runs"
    X-Drive:
        path: "X:/shared/modeling/outputs"
        description: "X: shared modeling outputs folder"
zones:
    TAZmap:
        path: "C:/GIS/shapefiles/taz-map.geojson" #note this must be geojson format
        lookup: "zonenumber"
        sizes: 1475,2475   # matrix sizes that correspond to the geojson boundaries
Note that on Windows, directory paths use the weird Python C:/forward/slash/format instead of the usual \\ backslashes.
Zonal files must be in .geojson format (or gzipped to .geojson.gz) with long/lat coordinates. You can convert any shapefile to GeoJSON using QGIS and other tools.
Once installed, you can also keep up with SimWrapper updates by running uv tool upgrade simwrapper. uv really makes managing (Python) software a million times easier than the old pip and conda tools. The simwrapper tool is on Pypi here: https://pypi.org/project/simwrapper/
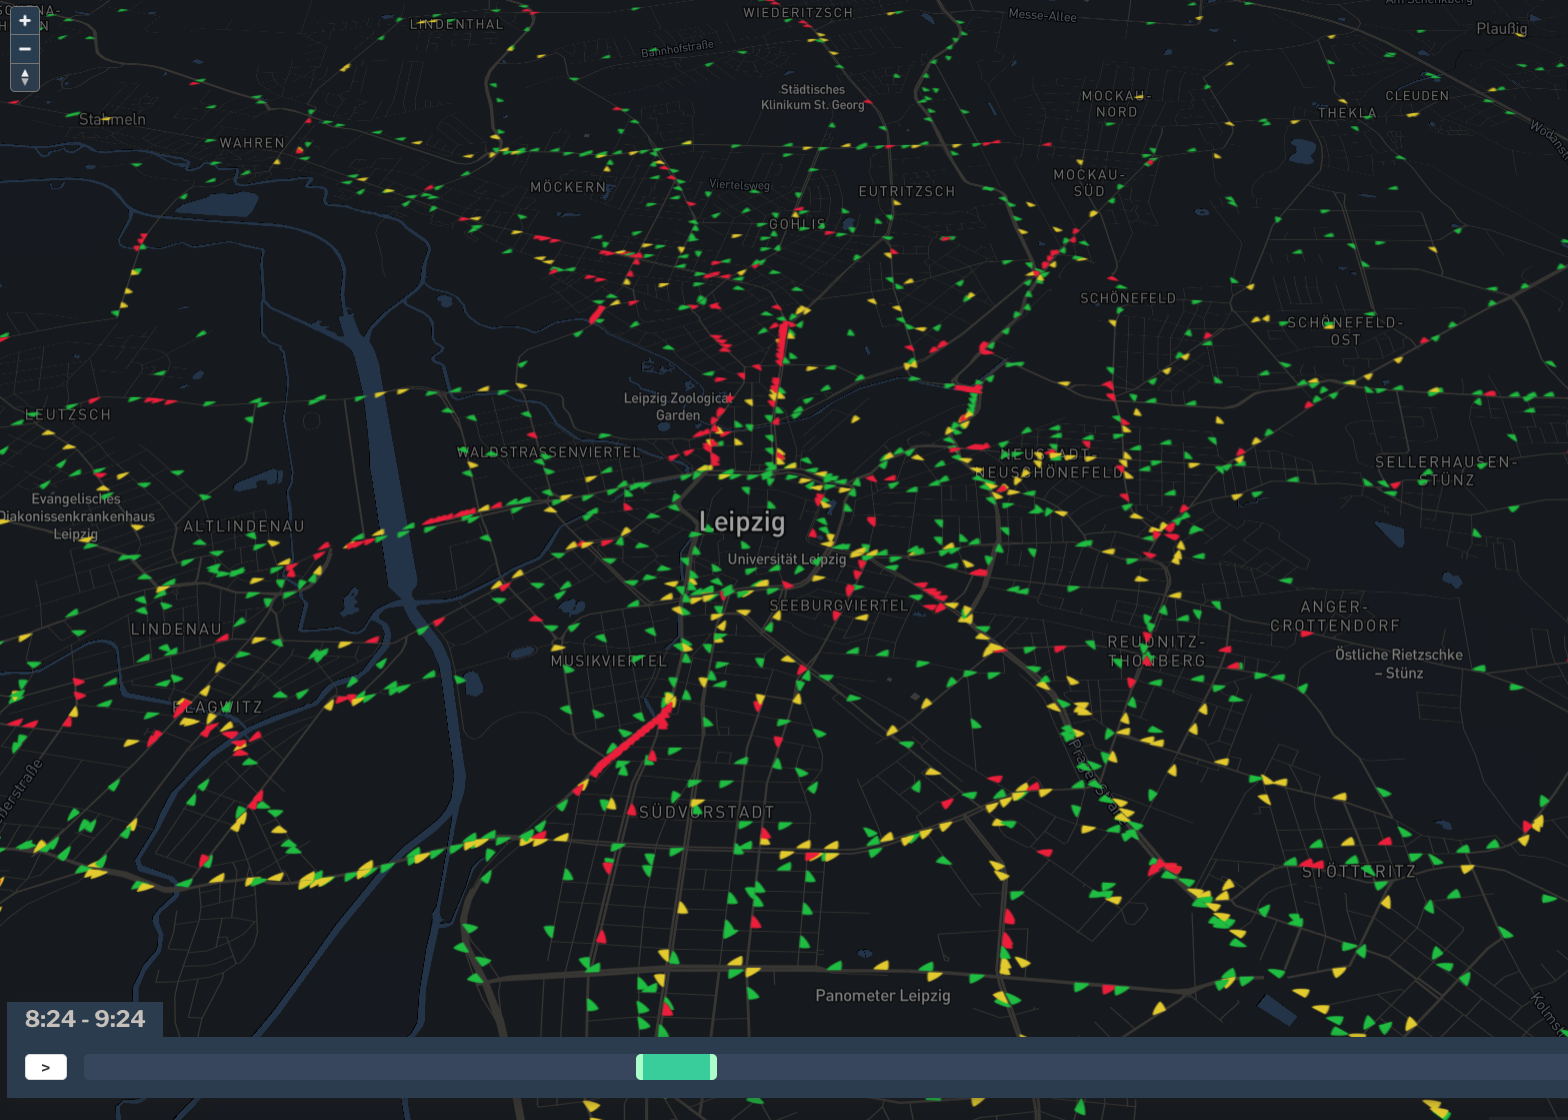
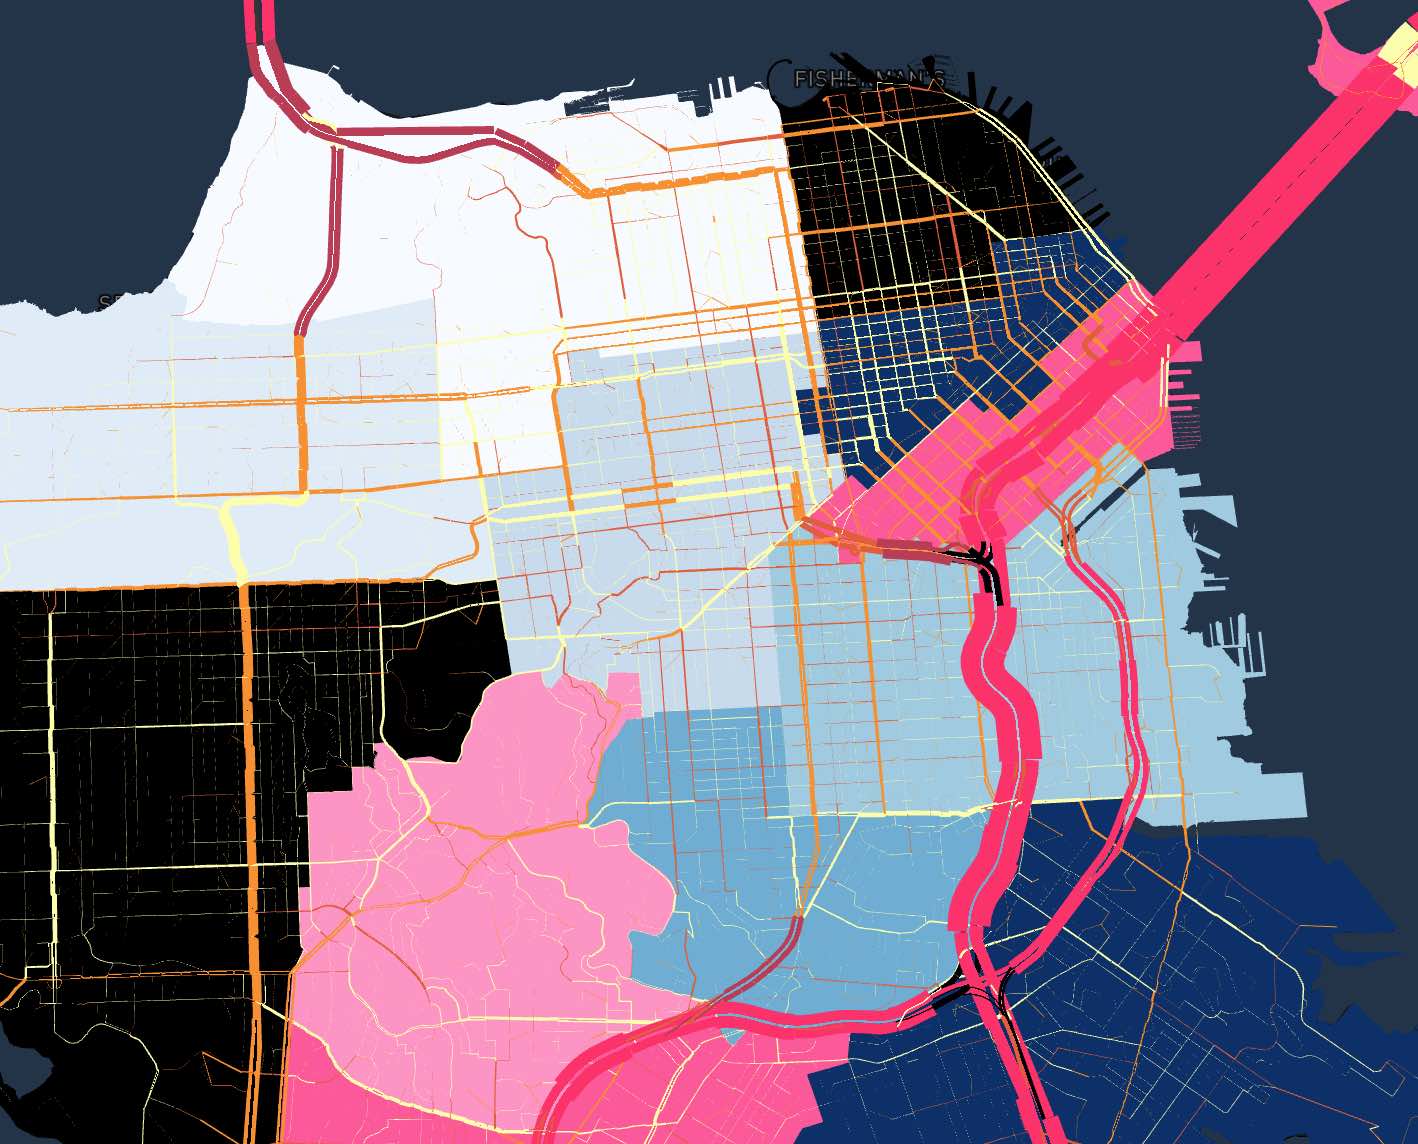
Background shape layers underneath all maps
Background layers are very useful for depicting service and study areas, neighborhood borders, etc. The shapefile viewer always allowed background maps underneath it, but now every map visualization in SimWrapper can have background layers underneath your primary data:
In the YAML configuration for your view or dashboard, add the following:
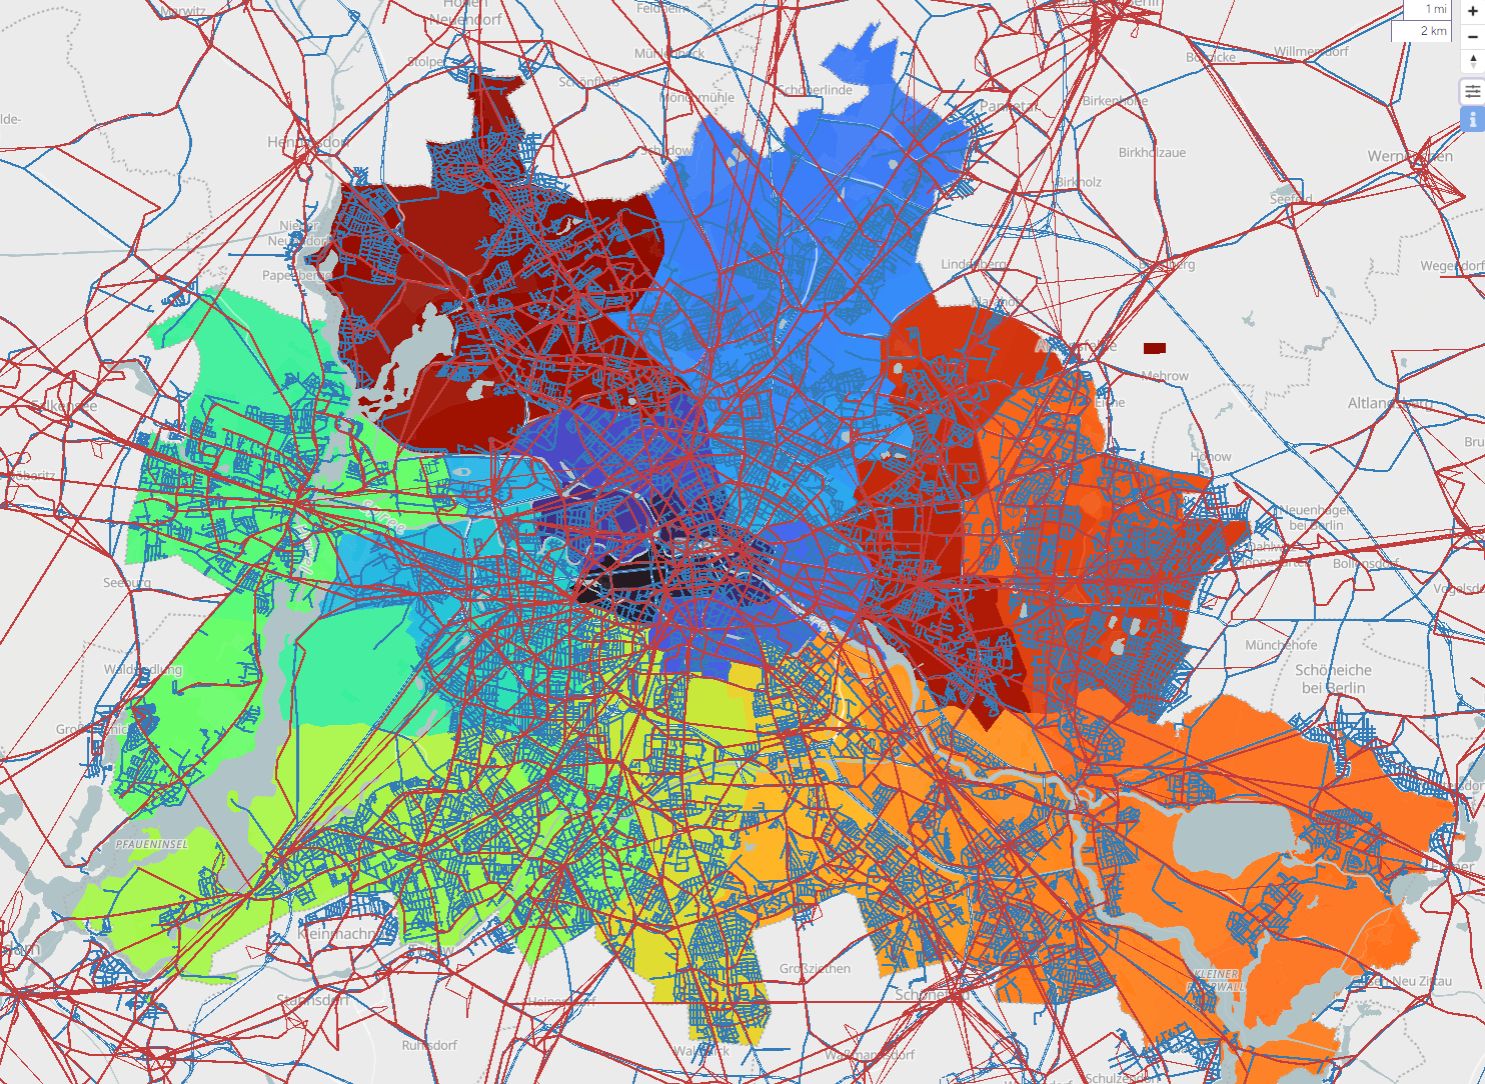
Example adding Berlin neighborhoods to a YAML:
backgroundLayers:
  berlin:
    shapes: "berlin-bezirke.gpkg" # or .shp
    fill: "Viridis" # or 'salmon', or '#08f"
    borderWidth: 2
    borderColor: 'darkblue'
    opacity: 0.8
    onTop: false
Geopackage .gpkg and shapefile .shp formats are supported; you can convert to Geopackage easily from QGIS and other tools. The other settings should be self-explanatory.
Better memory management - fewer tab crashes ☠️
We upgraded some longstanding technical debt and are now using the latest versions of Vite, Deck.gl, and MapLibre. What this means for you is that tab memory management is massively improved: large datasets shouldn't crash your browser tabs nearly as often 😅
SimWrapper still uses a fully in-browser app approach, meaning there is no back-end database filtering large datasets. It's a design feature, not a bug, enabling you to fully control your data: stuff never get uploaded to the cloud. But this also means that large datasets can still crash your tabs sometimes. It's a limitation of web browser technology that we can't really get around... but with this new version, even larger datasets should be manageable.
🎮 GamePad controller support 🕹️
Now you can control all map views using a USB or Bluetooth gamepad controller! Note that not all controllers are fully supported in all browsers, so try different ones if your first controller is not recognized.
Left stick moves the map, right stick rotates and changes zoom. Hold down the left Z/trigger button and move the sticks to control pitch. there is also an invert axes option in the main SimWrapper settings (the gear in the upper right) for you gamers.
Great for interactive demos!
More to come!
Please start a chat or follow along on the SimWrapper discussion board if you have suggestions, comments, cheers & jeers!
We are working on lots of other new features and continue to sharpen SimWrapper based on your feedback! Thanks for your support 🙏