
Getting started tutorial
Welcome to SimWrapper! Let's get you up and running with the basics. This guide uses sample data that's hopefully a lot like the data you have for your projects
➡ Use a Chromium-based browser: Chrome/Edge/Brave and others, for this guide.
Other browsers (Firefox, Safari) can work, but require a separate local HTTP server to access local files on your computer. For now, that's just a stumbling block to getting started. Safari is a particularly bad browser for data visualization, since Apple doesn't support the latest APIs nor local file access, and Safari has the slowest Javascript engine! 🐳
How it works: SimWrapper and file-based configuration
Your transport simulation produces a lot of files for every run, some of them quite large! MATSim/ActivitySim outputs such as the *.xml.gz files are usually too big to open in a web browser. SimWrapper provides a set of visualization plugins which load the raw data, or more often, load post-processed files which contain only the data that you wish to display. Plugins exist for lots of things and the list is growing: link volumes, agent animations, aggregate area summaries, and more.
On top of this, you can collect various visualizations into dashboards that you can lay out logically to help your users find the data they need.
Here's how it works: For every visualization or dashboard you want to create, you write a small configuration file and store it in the same folder as the inputs for that visualization. These configs are in the simple YAML text format and SimWrapper looks for YAML files with specific names to learn what it should read and display (more on this below).
Generally, a viz will require a specific set of inputs, and those inputs are either raw simulation outputs or the result of some post-processing of the outputs. It's up to you to do that post-processing and store the resulting files in the same folder as your YAML config files.
Let's get started with some sample data.
1. Get the sample data and open it in SimWrapper
- Download simwrapper-example-project.zip from GitHub
- Unzip the file somewhere you can find it easily - Desktop, home folder, etc.
- Go to https://simwrapper.app and click
View local files...and browse to the folder you just created. Grant access to the folder so the SimWrapper website can see the files! - Click on the
datafolder. You will find dashboard examples and some raw data from a few MATSim runs.
If you are using Firefox, there is no "View local files" button. Instead cd to the data folder and run simwrapper here to start the local HTTP server. This requires first running pip install simwrapper to get the simwrapper command-line helper app. I suggest you use Chrome/Edge/Brave for this tutorial!
You should now see something similar to this:
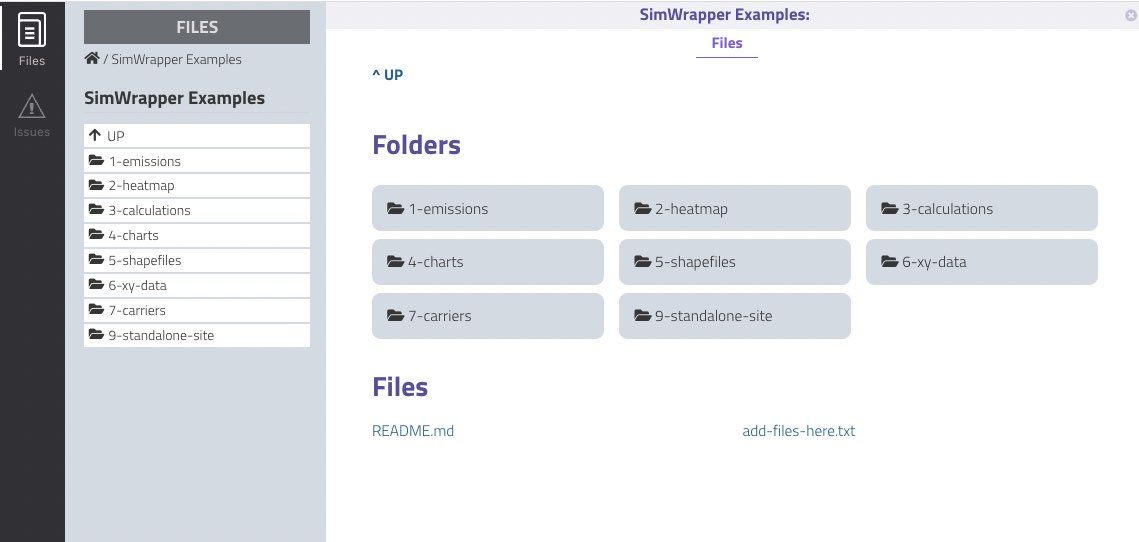 Example data folder
Each of the subfolders in the example project shows different map views and capabilities of SimWrapper -- network link plots, statistical charts, area maps (shapefiles), dashboards, and so on.
- Experiment with the various knobs and configuration settings in the visualizations to see how they can be manipulated
- From your PC file explorer / Finder, find the YAML text files named
viz-*.yamlin each subfolder to see how each of the visualizations is defined in a clear, readable text format. - Every visualization type has a different filename "prefix" to help you find them: e.g,
viz-map-*.yamlare for shapefiles,viz-link-*.yamlare for MATSim network plots, and so on. - Try making a copy and editing these YAML files. Save and click
Reloadon your browser to see how your changes affect the visualizations.
2. Create a dashboard with some charts
The dashboards subfolder shows how you can combine multiple visualizations into cohesive dashboards.
- The
dashboard-*.yamlfiles define each individual tab in a dashboard. It's often nice to name themdashboard-1-*.yaml,dashboard-2-*.yamletc, to set them in the order that you like. - Dashboards are laid out in rows: Each row can have multiple panels. See the YAML files for how this works!
See the Dashboards in Depth article to learn more about building multi-panel dashboards.
4. Configuring dashboard templates for multiple run folders
In SimWrapper, everything is file- and folder-based. So viz-*.yaml and dashboard-*.yaml files in a folder will automatically be detected and loaded, based on their filenames.
If you want to define dashboards that will be used for multiple folders, such as several runs for a particular project:
- Create a folder named
simwrapperor.simwrapperin the parent project directory. - Move all dashboard, viz, and template YAMLs into that folder
- Tweak any file paths as necessary, so that relative file names resolve properly.
- The base folder for a dashboard is the folder you are viewing, not the dashboard template folder.
- You can have multiple
simwrapperfolders all the way up your folder hierarchy; dashboard panels will be generated based on filename, and each found dashboard will be displayed as a tab on the dashboard.
5. More on YAML filenames
SimWrapper looks in your folder for YAML files that follow specific naming conventions. That way, it won't try to read unrelated YAML files that you might have. But this means you must name your configuration files carefully! SimWrapper will silently ignore all YAML files that do not match these conventions:
dashboard-*.yaml- these contain the configuration settings for dashboard panes. Each found file results in a left-side tab on the dashboard page, and that tab contains the dashboard contents specified in this file. For this reason, many users tend to number their dashboard configs so that the tabs always appear in a predictable order:dashboard-1-summary.yaml,dashboard-2-mode-choice.yaml,dashboard-3-traffic.yamland so on.viz-*.yaml- these contain individual map-based visualizations. Each of these will appear on the Files tab of a folder.- Each visualization plugin has a specific subname that must follow
viz-subname-...in the filename: for example, the shapefile viewer would beviz-map-*.yamlwhile the xy-hexagon viewer isviz-xy-*.yaml. See the API reference for each plugin for examples. - Use these
viz-*configs if you don't have the need to collate multiple vizes into dashboards, or if you want single visualizations to have their own URL that you can link to directly.
- Each visualization plugin has a specific subname that must follow
simwrapper-config.yaml- is a special top-level configuration for project sites that is described in detail on Building a project site.
Note that in most cases, both .yaml and .yml file extensions are valid and honored.
6. Example roadway links visualization
Here is an example YAML config file for a link-volume summary:
viz-links-example.yaml:
title: 'Taxi Passengers'
description: 'Hourly passenger pickups'
csvFile: 'vol_passengers.csv'
geojsonFile: '../road-network.json.gz'
projection: 'EPSG:25832'
sampleRate: 0.10
This config names two files, a CSV of link volumes and a zipped JSON file of the MATSim road network, and some parameters needed for the viz to work. Those files are outputs of some post-processing scripts described in the plugin docs.
If you wanted to look at several different link volume plots from the same model run, (e.g. for vehicle counts instead of passengers), you would make a copy of this file, give it a different name, and edit the csvFile parameter to point to the correct CSV.
This is a very different paradigm than most "point and click" GIS tools, but we have found that the ability to script and cut/paste the config files has been a huge time saver and also reduces manual errors.
Visualization types
Each visualization is described in the API Reference section of this documentation, including how to post-process your outputs if necessary, and how to define any configuration settings for your visualizations.