
Aggregate O/D flows
 Aggregate O/D, or "Spider" Diagram
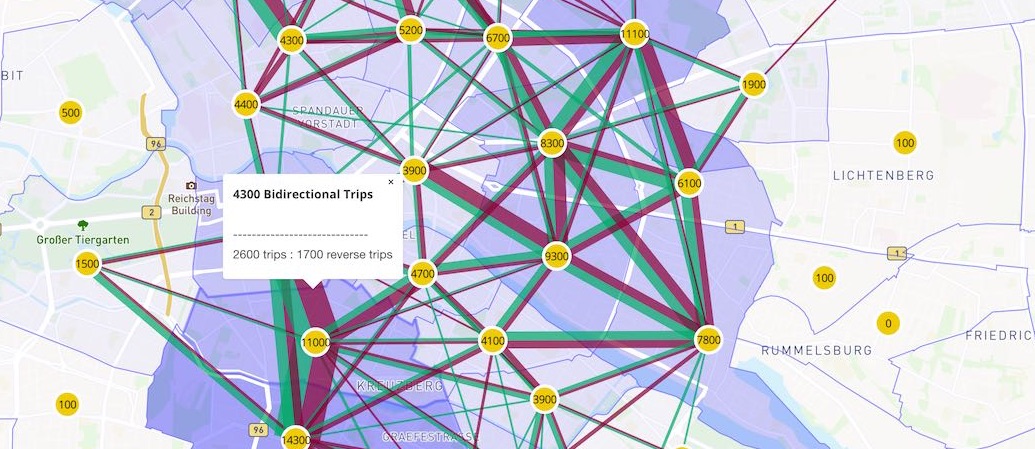
This viz shows aggregated flows between areas defined by a shapefile. The default view shows everything all at once for every centroid-to-centroid pair. This can be overwhelming, so you can also click on an individual centroid to see just the flows to and from that selected zone.
Usage
A file named viz-od*.yml must be present in working folder. Each yml file matching that pattern will produce a separate Aggregate O/D diagram.
viz-od-example.yml
# all of the below are required except description and idColumn.
title: 'My Aggregate Viz'
description: 'this will be in the sidebar'
shpFile: Bezirksregionen_zone_GK4_fixed.shp
dbfFile: Bezirksregionen_zone_GK4_fixed.dbf
csvFile: od-analysis-hourly-drt.csv
projection: GK4
scaleFactor: 100
idColumn: 'id'
lineWidth: 50
Input Files
Shapefile: The DBF data must contain a column with the ID of the zones/regions. This ID will be used to identify the O/D flows in the CSV file
- if the
idColumnis not specified in YAML then the defaultidwill be used. - If no ID column can be found, then the plot will attempt to use the first column in the DBF file.
O/D CSV File format:
- Header line contain labels; first two column names will be used for from/to (e.g. origin/destination)
- Column 1: 'From' category
- Column 2: 'To' category.
- All further columns list flows from/to. For example, there could be 24 columns, one for each hour of travel
origin;destination;1;2;3;4;5;6;7;8;9;10;11;12;13;14;15;16;17;18;19;20;21;22;23;24
88;88;0;0;0;0;0;0;0;0;0;0;0;0;0;0;0;0;0;0;0;0;0;0;0;0
88;89;0;0;0;0;0;0;0;0;0;0;0;0;0;0;0;0;0;0;0;0;0;0;0;0
88;110;0;0;0;0;0;0;0;0;0;0;0;0;0;0;0;0;0;0;0;0;0;0;0;0
88;111;0;0;0;0;0;0;0;0;0;0;0;0;0;0;0;0;0;0;0;0;0;0;0;0
88;112;0;0;0;0;0;0;0;0;0;0;0;0;0;0;0;0;0;0;0;0;0;0;0;0
etc...
Configuration Parameters
projection: Coordinate projection, such as "EPSG:31468" or "GK4"
scaleFactor: Factor to scale all values -- to handle 1% or 10% scenarios, for example
lineWidth: Starting width scaling of lines
idColumn: Data column in shapefile which contains the ID for regions/zones (default "id")