
Heatmap chart
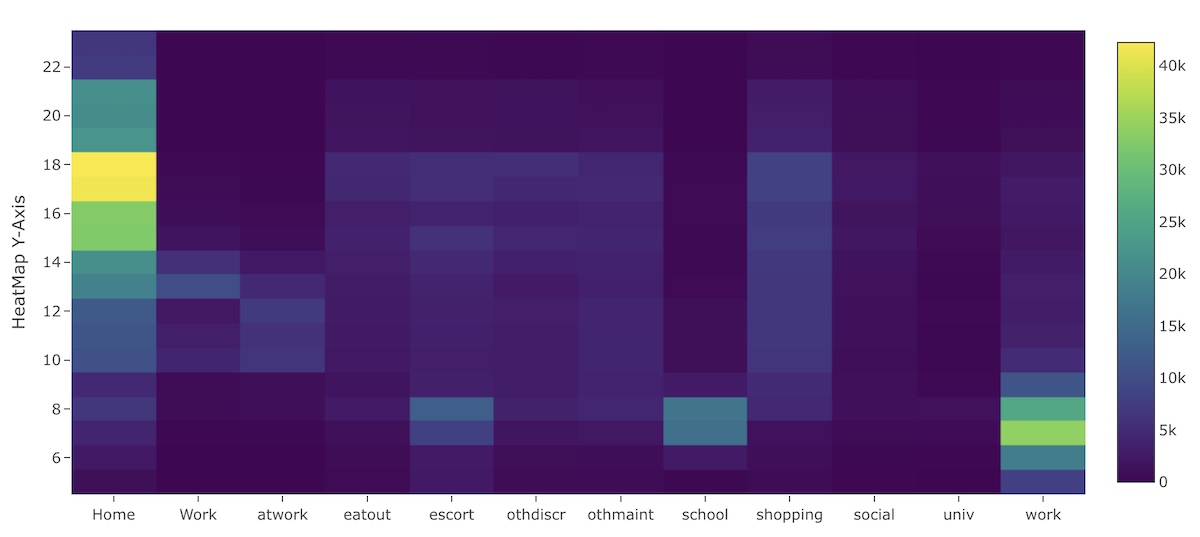 Heatmap depicting Time of day vs. activity purpose
A heatmap chart depicts aggregate data in two dimensions on one chart.
Usage
Heatmap charts can only be included as panels in Dashboards. See Dashboard documentation for general tips on creating dashboard configurations.
- Use panel
type: heatmapin the dashboard configuration. - Each heatmap panel is defined inside a row in a
dashboard-*.yamlfile. - Standard title, description, and width fields define the frame.
Sample dashboard.yaml config snippet with a heatmap
layout:
  row1:
    - title: "My Heatmap"
      type: heatmap
      dataset: "trips-tod-wide.csv"
      y: depart
      columns: ['Home','Work','atwork','eatout','escort','othdiscr','othmaint',
                'school','shopping','social']
      xAxisTitle: "Activity Purpose"
      yAxisTitle: "Time of Day (Hour)"
      flipAxes: true
Heatmap chart properties
Heatmap chart properties:
dataset: String. The filepath containing the data. May include wildcards * and ?.
y: column containing y-value data.
columns:: Array[] containing names of columns with data to be categorized on the x-axis. See example above.
xAxisTitle and yAxisTitle: Descriptive titles for the x-axis and y-axis (optional).
flipAxes: True/false. Transpose the heatmap matrix, thus flipping the x and y axes. Can be useful if your data is stored one way but you want it displayed the other.