
Flow maps
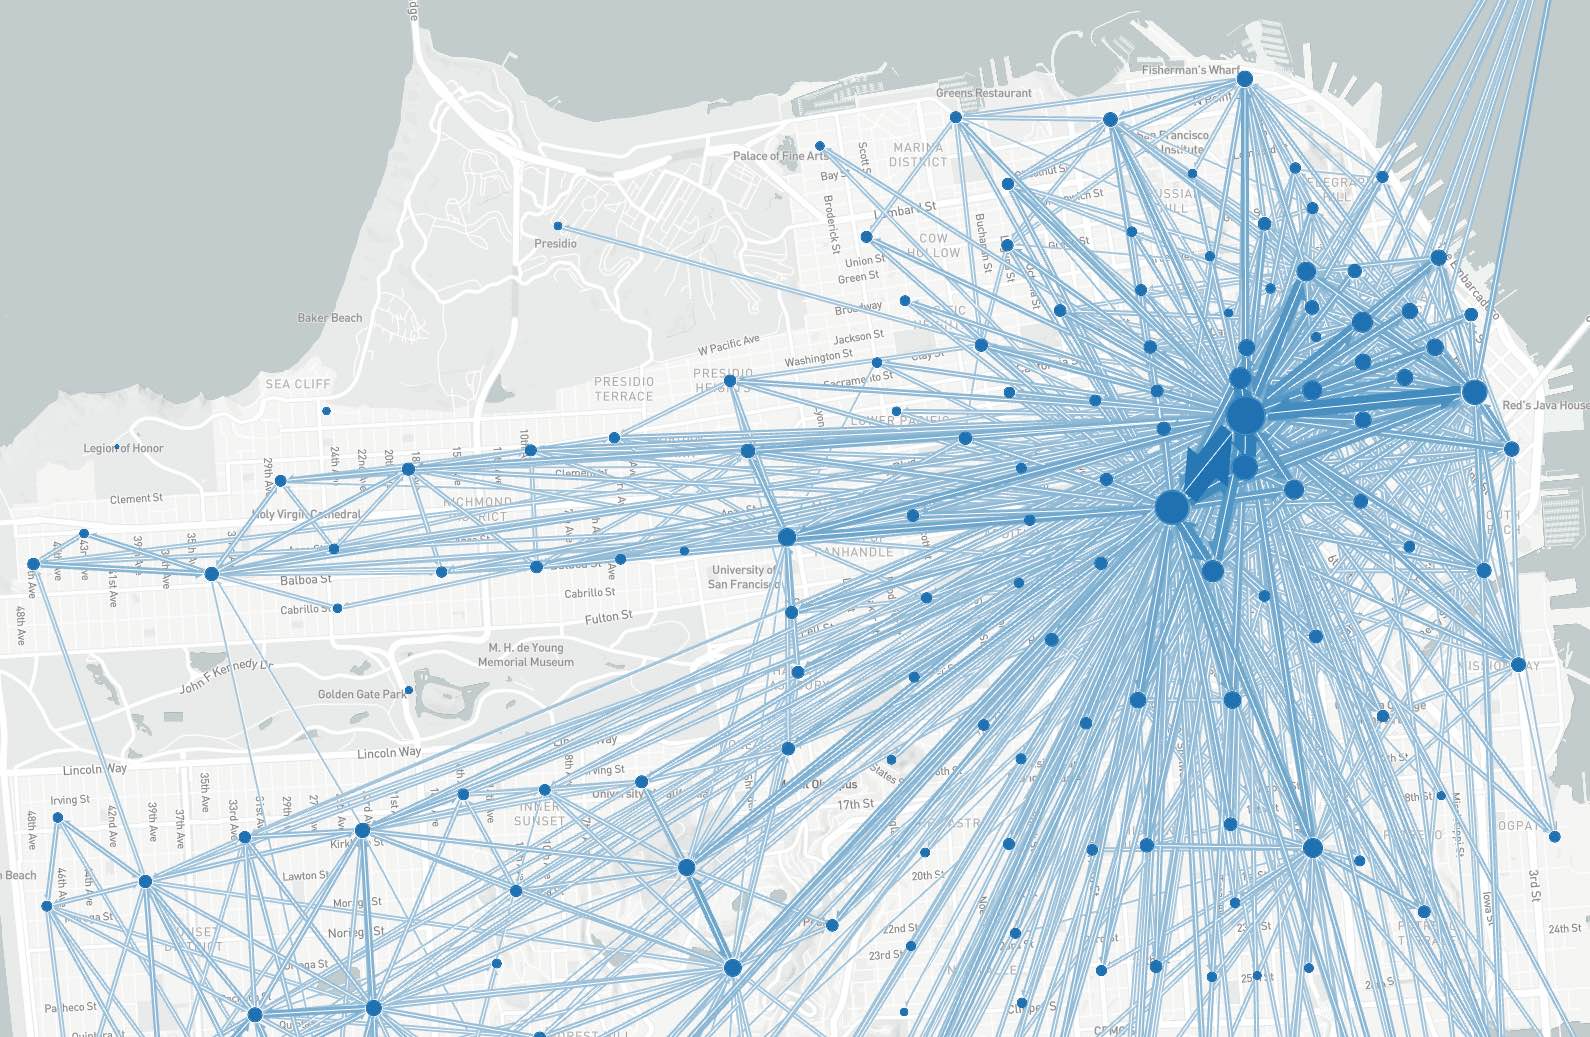 A flow map of San Francisco
Flowmaps depict aggregate movements between origins and destinations.
Usage
Flow maps can be included as panels in Dashboards or used as a standalone map. See Dashboard Guide for general tips on creating dashboard configurations.
Standalone: Create a viz-flowmap*.yaml file as described below
-or-
Embed in Dashboard: Create a dashboard-*.yaml file and include a type:flowmap section as desccribed below.
- Each chart panel is defined inside a row in a
dashboard-*.yamlfile. - Standard title, description, height, and width fields define the frame.
Configuration reference properties
NOTE: These properties all go into a viz-flowmap*.yaml file as-is, or, in a dashboard file they all go under the props: section of a layout row. See the examples at the end of this document.
General
- title: (optional) title of the visualization, appears right on top of the map. In the case of a dashboard: if a title is specified both under
generaland underprops, the one undergeneralwill be used. - description: (optional) description of the visualization, appears between title and map. In the case of a dashboard: if a description is specified both under
generaland underprops, the one undergeneralwill be used.
Data
Two sets of data are needed: geographical data in the form of a .geojson file and a .csv file containing the the flow data. The .geojson file can contain polygons or points. To make a join between the .geojson file and the .csv file possible, the feature IDs in the columns boundariesJoinCol, origin and destination need to match.
- boundaries: Geojson file with feature element boundaries.
- boundariesJoinCol: The property in the boundary file containing the feature ID
- boundariesLabels: The human readable name for the boundary ID column
- dataset: CSV file containing at least three columns: origin, destination, and flow.
- origin: The column name containing origin IDs
- destination: The column name containing destination IDs
- flow: The column name containing flow values
General Map Settings
These settings are optional. Depending on the data used and the focus of the work, adjustments may be helpful though.
- center: (optional) coordinates that the map centers on. Can be provided as array or string. If it is not provided, a center is calculated using a sample of the data.
- zoom: (optional) zoom level of the map between 5 and 20. If it is not provided, the zoom level 9 is used.
- pitch: (optional) If it is not provided, the pitch is 0.
- bearing: (optional) If it is not provided, the bearing is 0.
Labels
- locationLabelsEnabled: (optional)
trueorfalse. Turns the location labels on and off. If it is not provided, it istrue. - pickable: (optional)
trueorfalse. Whentrue, hovering over a flow highlights it. If it is not provided, it istrue.
Flows
- animationEnabled: (optional)
trueorfalse. Turns the animation of the flows on and off. If it is not provided, it istrue. - opacity: (optional) value between
0and1, describes the opacity of the flows. If it is not provided, the opacity is0.
Clustering
Unless otherwise specified clustering is turned on, meaning the flows aggregate based on the zoom level. This is recommended for most datasets. When vizualising smaller datasets, where there is less overlap of the flows or trying to show specific details clustering can be turned off and a specific clustering level can be used instead.
- clusteringEnabled: (optional)
trueorfalse. Turns the aggregation of the flows on and off. The standard value used istrue. - clusteringAuto: (optional)
trueorfalse. Turns the automatic scaling of the clustering on and off. If turned off, a value for clusteringLevel should be provided. The standard value used istrue. - clusteringLevel: (optional) The aggregation level of the flows. Relevant if clusteringAuto is
false. Integers between 1 and 20.
Sample dashboard.yaml config snippet
layout:
  - type: 'flowmap'
    title: 'Trip Origin/Destination Flows'
    description: 'Major flows shown'
    height: 10
    boundaries: 'taz1454.geojson'
    boundariesJoinCol: 'TAZ1454'
    boundariesLabels: 'TAZ'
    dataset: 'trip-od-flows.csv'
    origin: 'origin'
    destination: 'destination'
    flow: 'trips'
    animationEnabled: false
    clusteringEnabled: true
    clusteringAuto: true
    clusteringLevel: 20
    locationLabelsEnabled: true
    pickable: true
    opacity: 1
Sample viz-flowmap.yaml config snippet
title: 'Trip Origin/Destination Flows'
description: 'Major flows shown'
boundaries: 'taz1454.geojson'
boundariesJoinCol: 'TAZ1454'
boundariesLabels: 'TAZ1454'
dataset: 'trip-od-flows.csv'
origin: 'origin'
destination: 'destination'
flow: 'trips'
zoom: 9
adaptiveScalesEnabled: true
animationEnabled: true
clusteringEnabled: true
clusteringAuto: true
clusteringLevel: 20
locationLabelsEnabled: true
pickable: true
opacity: 1