
CSV table viewer
 CSV Table Viewer
The CSV table viewer is able to display (small) csv files clearly.
Usage
The table viewer can only be included as panels in Dashboards. See Dashboard documentation for general tips on creating dashboard configurations.
- Each table viewer panel is defined inside a row in a
dashboard-*.yamlfile. - Use panel
type: csvin the dashboard configuration. - Standard title, description, and width fields define the frame.
Sample dashboard.yaml config snippet
layout:
  row1:
    - type: 'csv'
      title: Example Title
      dataset: 'data.csv'
      enableFilter: true
      hide: [bike, car]
      show: [bus]
      showAllrows: false
      hideHeader: false
      style: default
Styles
The Table plug-in provides various styles.
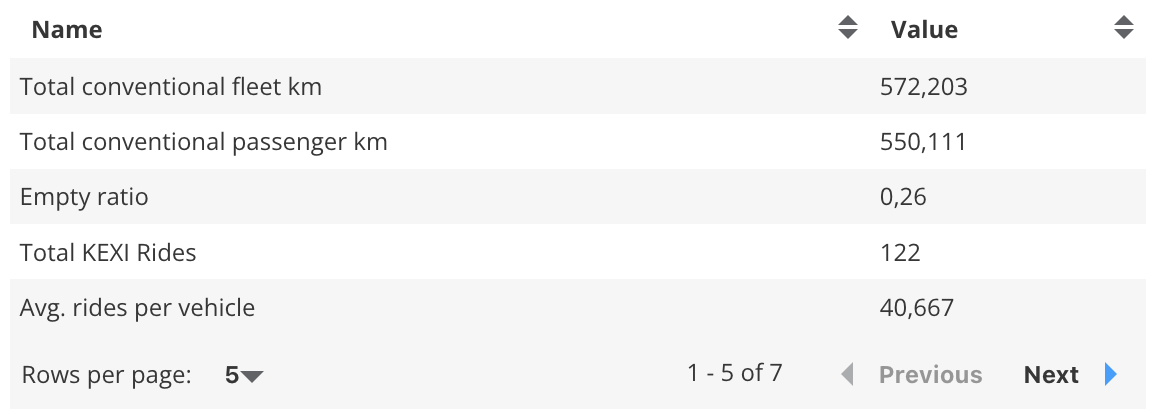
Default Style:
style: default # Or just leave blank
Default Style
Topsheet Style:
style: topsheet
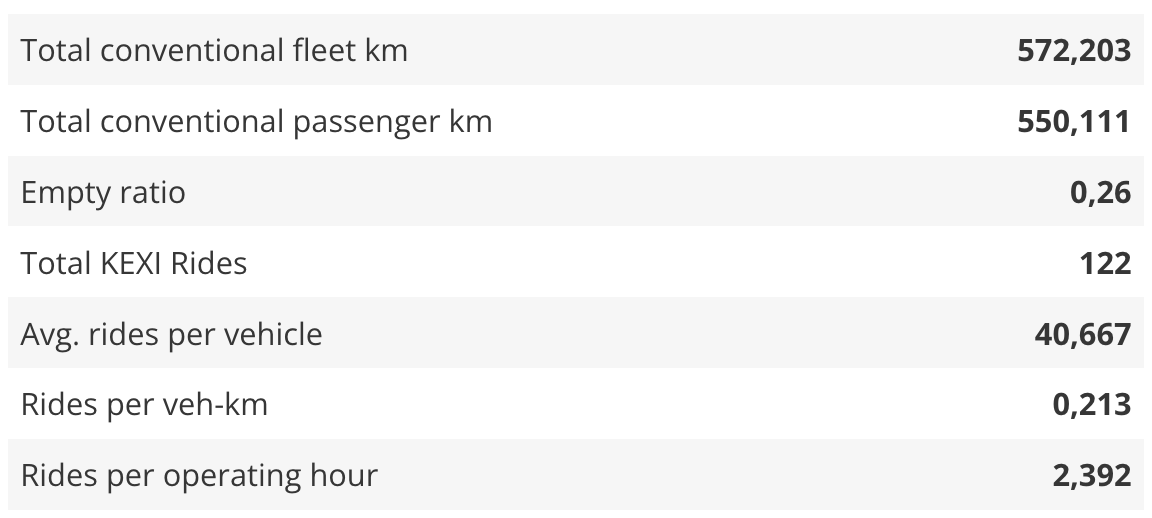 Topsheet Viewer
Table viewer properties
Table viewer properties:
dataset: String. The filepath containing the csv-file.
enableFilter: true/false. This option could be used to filter columns. This option adds a filter mask to each column. The default setting is false.
hide: Array of strings. List of column names that should be ignored.
show: Array of strings. List of column names that should be displayed. If the hide and show option are in the .yaml file the hide option will be ignored.
showAllRows: true/false. This option defines whether the whole table should be displayed or if there are several pages. The default setting is false.
style: String. This option specifies which style the table should have. The default value is default. Which styles are available can be looked up here.
hideHeader: true/false. This option defines whether the header is visible or not. The default is false. Note: Even if no header is to be displayed, the table needs a header row.