
Tiles
 Tiles
Tiles
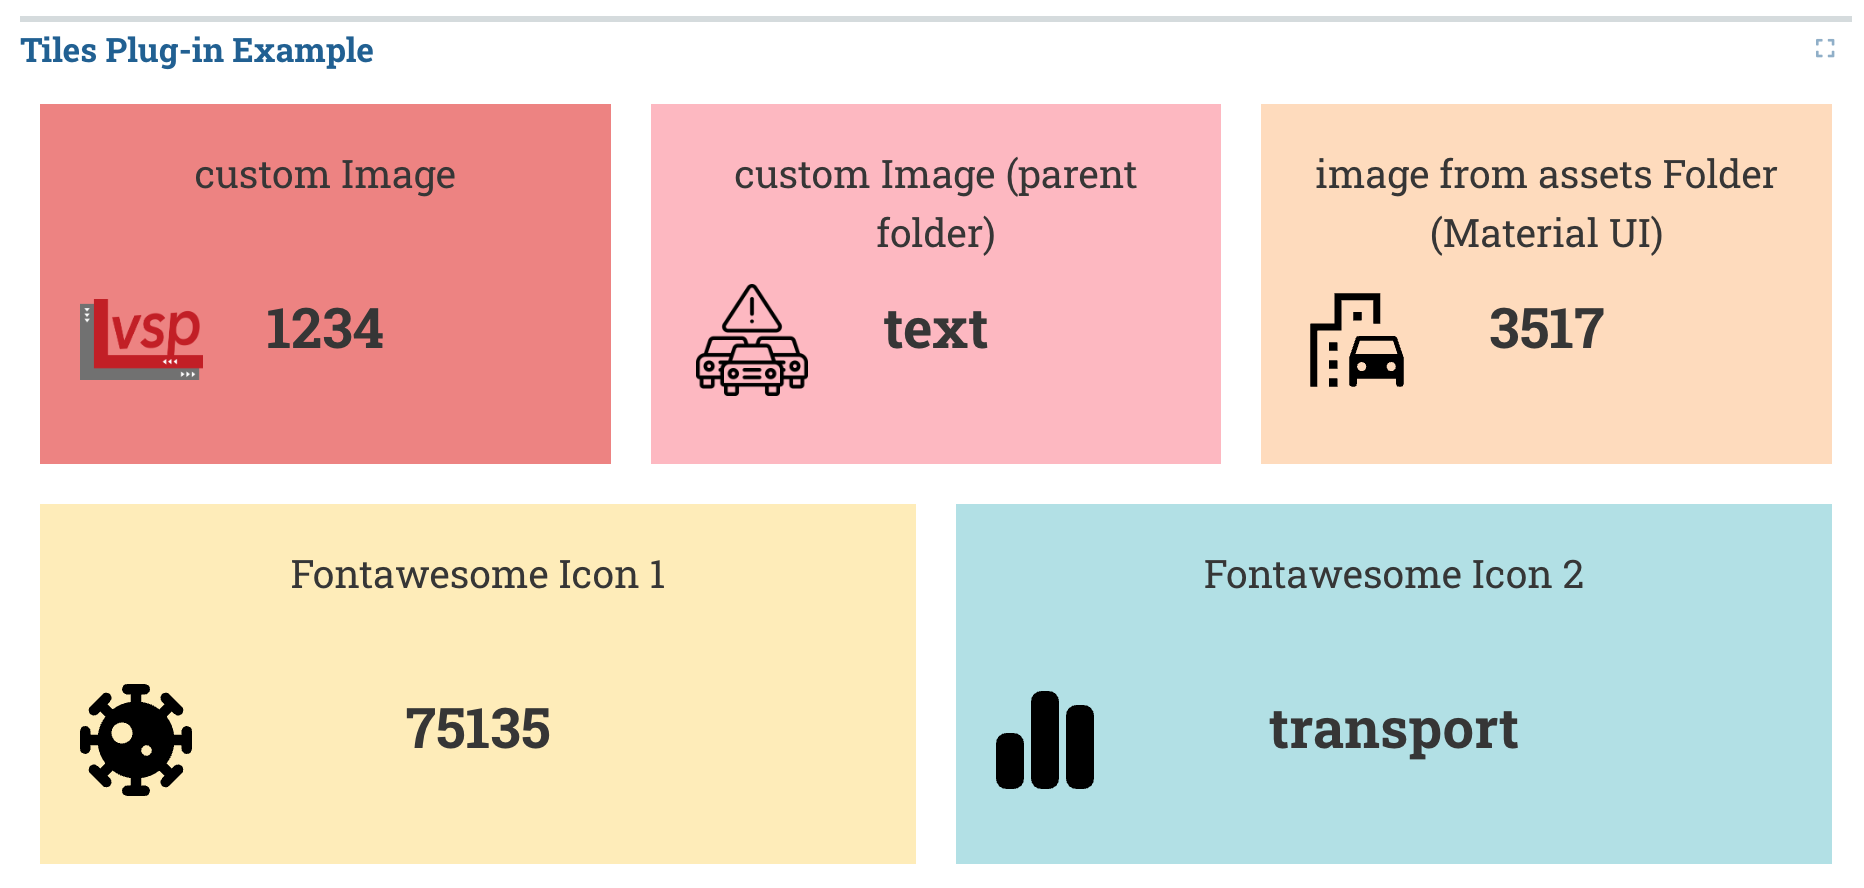
The Tiles plug in displays key data for a good overview.
Usage
The tiles plug-in can only be included as panels in Dashboards. See Dashboard documentation for general tips on creating dashboard configurations.
- Each table viewer panel is defined inside a row in a
dashboard-*.yamlfile. - Use panel
type: tilein the dashboard configuration. - Standard title, description, and width fields define the frame.
Data for the tiles can be provided in a number of ways,
- As a
.csvfile - Hard-coded
titleandvaluepairs - As a sqlite table
- As individual
titleand sqlite-query pairs
Additionally, the color palette for the tiles can be set via the colors parameter. Options are pastel (default), vivid, and monochrome.
Sample dashboard.yaml config snippet
For data source from csv, a sqlite table, hardcoded and a series of sqlite queries,
layout:
  csv_row:
    - type: 'tile'
      title: Tiles Plug-in Example
      dataset: 'data.csv'
  sqlite_table_row:
    - type: 'tile'
      title: "My Tile Panel"
      dataset:
        database: project_database.sqlite
        query: "SELECT metric, value FROM metadata_table;"
        titleCol: metric            (n.b., optional, these default to 'metric' and 'value')
        valueCol: value
  hardcoded_row:
    - type: 'tile'
      title: "My Tile Panel"
      dataset:
        - key: "Total trips"
          value: 54321
        - key: "Average speed"
          value: 23.4
  sqlite_queries_row:
    - type: 'tile'
      title: "My Tile Panel"
      dataset:
        - key: "Total trips"
          value:
            database: project_database.sqlite
            query: "SELECT COUNT(*) FROM trips;"
        - key: "Average speed"
          value:
            database: project_database.sqlite
            query: "SELECT AVG(speed) FROM trips;"
To change the color palette.
layout:
  csv_row:
    - type: 'tile'
      title: Tiles Plug-in Example
      dataset: 'data.csv'
      colors: 'monochrome'
CSV Structure
The following .csv structure belongs to the sample image above. The column line contains the titles, the second column the values, the third column the names or paths of the icons and the fourth defines the url. The values, the icons and the url are not required.
| custom Image | text | vsp_logo.png | https://vsp.berlin |
| custom Image (parent folder) | 1234 | ../warning.png | |
| image from assets Folder (Material UI) | 3517 | emoji_transportation | https://tu.berlin |
| Fontawesome Icon 1 | 75135 | virus-covid | |
| Fontawesome Icon 2 | transport | chart-simple |
Add icons to the tile
There are three ways to add icons. When adding icons, these three options are also checked in this order:
Custom Icons: To add your own icons, the file must be in the same directory and the relative path (including extension) must be specified in the .csv file.
Predefined Icons: See Predefined Icons. For adding only the name (without extension) must be specified.
Font Awesome Free Icons: For adding these icons only the name must be specified. An overview of the available icons can be found here. Only the icons from the Solid series will work.
Predefined Icons
| Name | Icon |
|---|---|
 | departure_board |
 | electric_car |
 | route |
 | local_gas_station |
| And many more... | And many more... |
For a complete overview, you can check here. You can also add more icons and save them in this folder. Please use this link and select these options for a consistent design: Grade: 0; Fill: true; Weight: 400; Optical Size: 48px.
Table viewer properties
Tiles plug-in properties:
dataset: String. The filepath containing the csv-file. The first row describes the header text and the second row describes the values
Notes
- Currently, Predefined Icons can't be used. GitHub Issue