
Gridmap
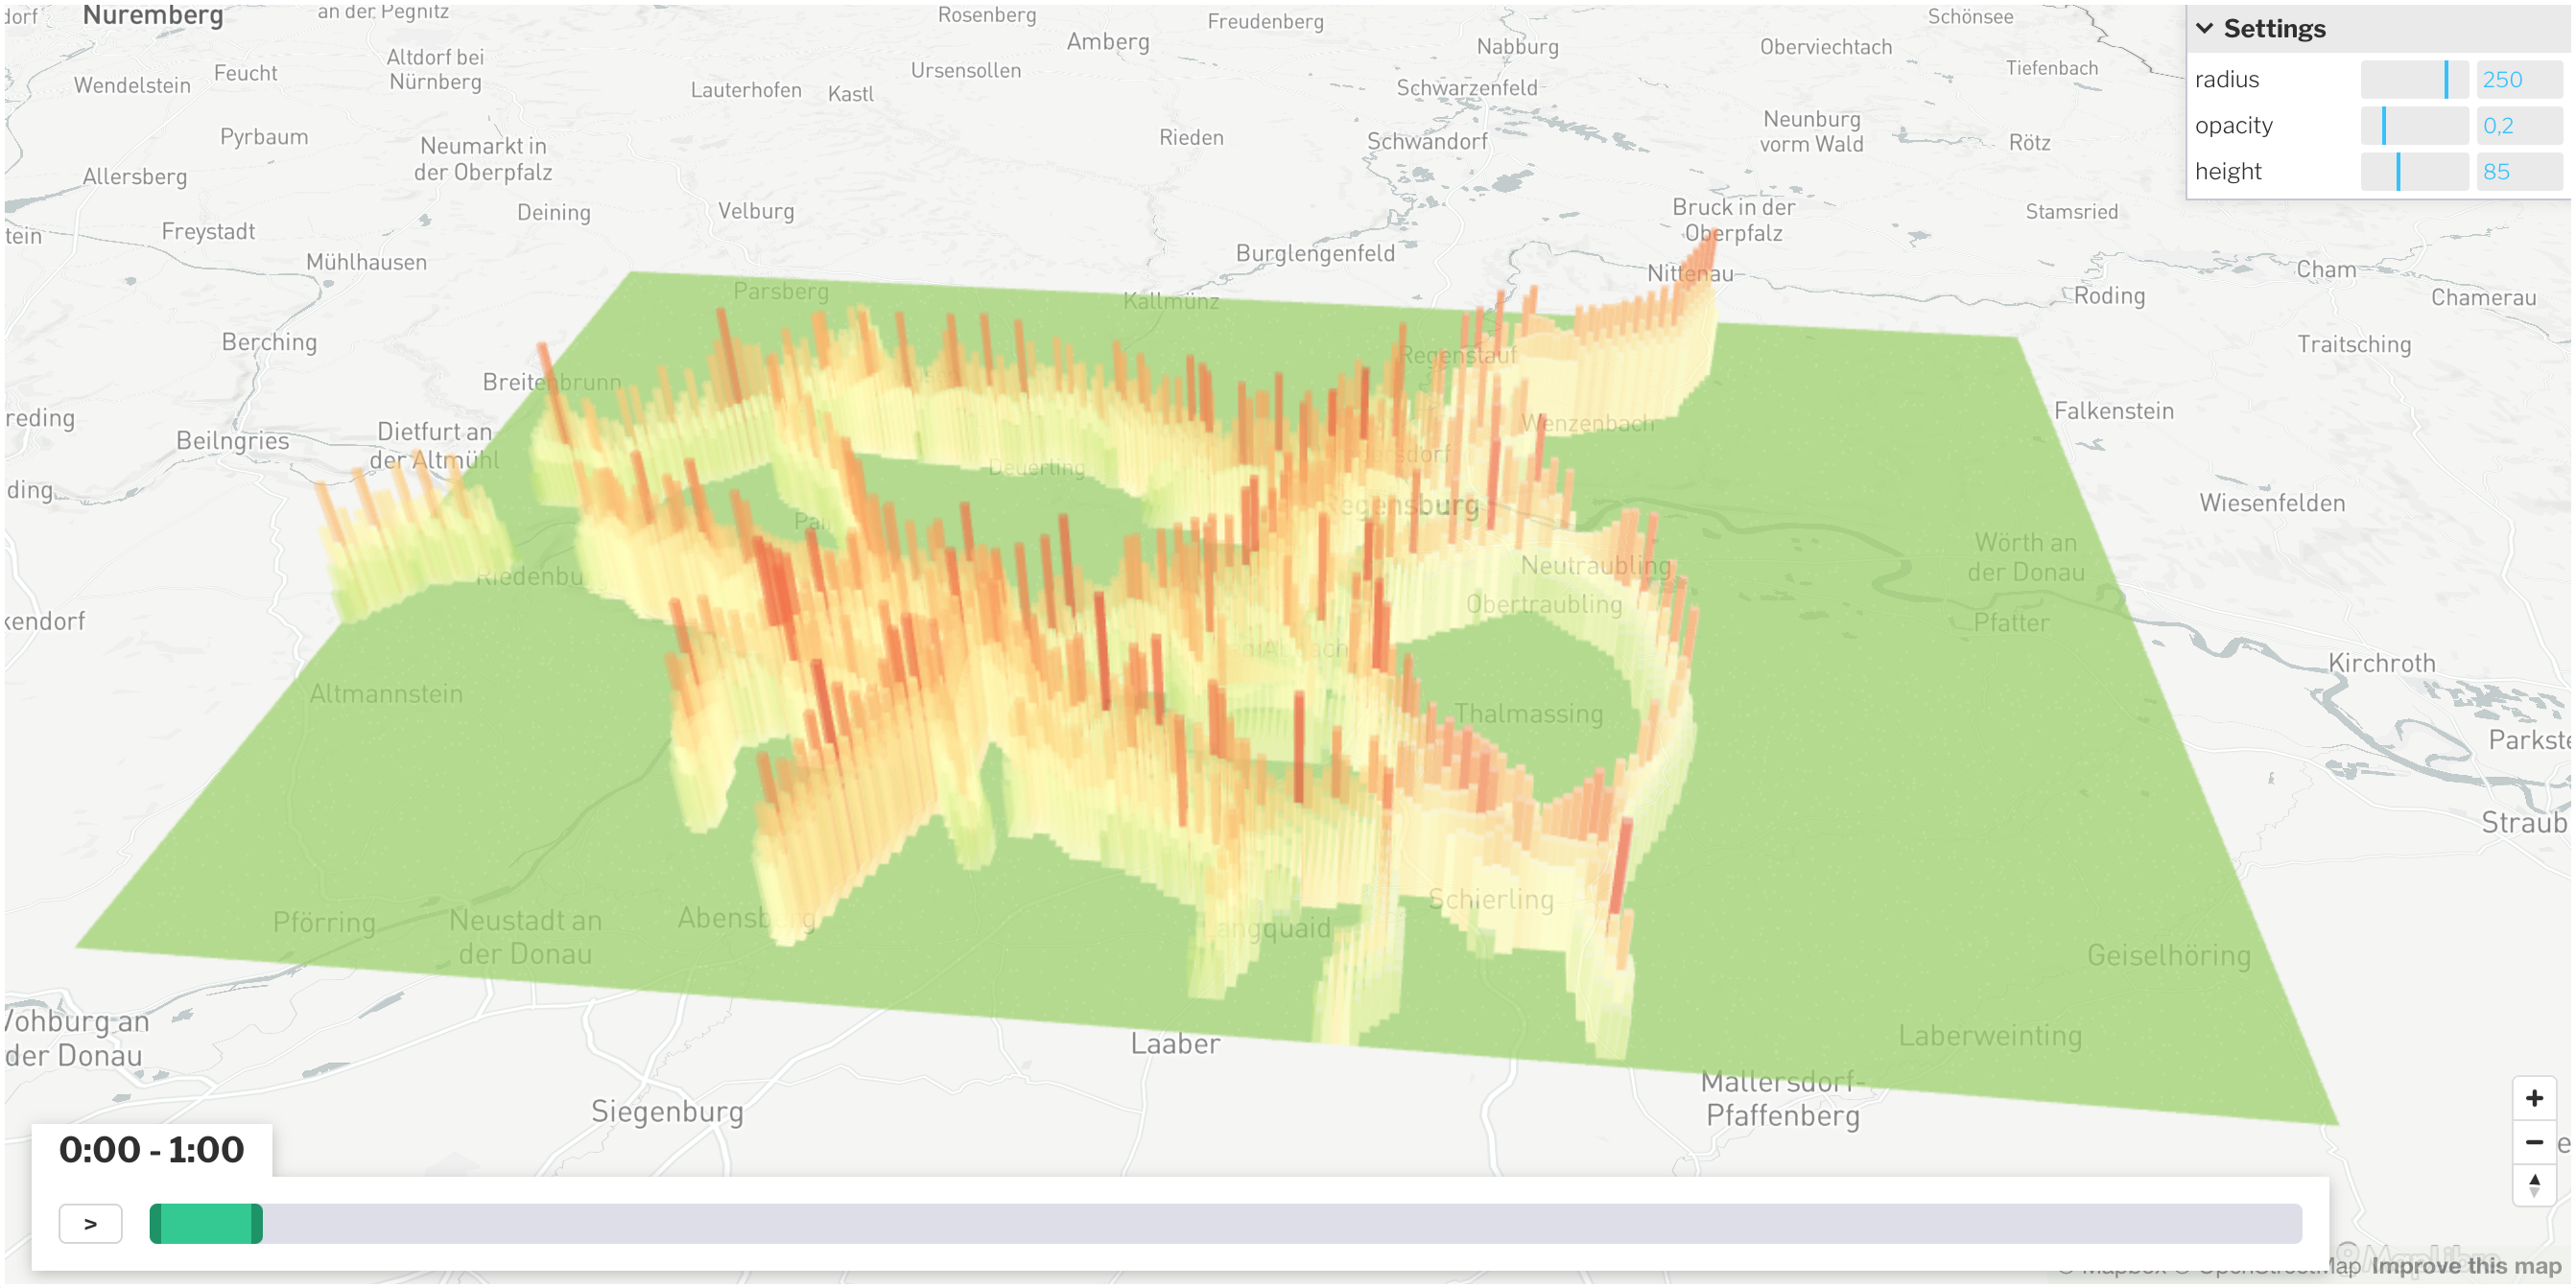 Gridmap plot over a period of time
Gridmap Plots are excellent for plotting emissions or other data at a specific point in time or over a period of time.
Creating this panel
Gridmap plots can be read in a dashboard file they go in the layout: section of a dashboard-*.yaml file. See the examples at the end of this document.
Embed in Dashboard: Create a dashboard-*.yaml file and include a type: gridmap section as described below.
- Each area map panel is defined inside a row in a
dashboard-*.yamlfile. - Use panel
type: gridmapin the dashboard configuration. - Standard title, description, and width fields define the frame.
- See Dashboard documentation for general tips on creating dashboard configurations.
Embed in Dashboard
In addition to the standard dashboard configurations, the following properties are available:
file: String. The file path to the .avro file containing the data. (Avro Schema)
cellSize: Number. Specifies the width/height of the grid elements (must be between 50 and 300). This value can be adjusted in the UI via the settings.
opacity: Float. Defines the opacity of the grid map. The value must be between 0 and 1 and can also be changed in the UI via the settings.
maxHeight: Number. Specifies the maximum height of the 3D grids. Must be a positive integer.
colorRamp/ramp: String. Specifies the colorramp. Possible colorramps are: Inferno, Magma, Viridis, Greens, Reds, RdYlGn, greenRed. The default value is Viridis.
The .yaml file could then look like this (Here are both variants of how to define breakpoints. However, only one of the two variants may be used at most):
- type: gridmap
  title: Noise Immissions
  description: Noise Immissions per day
  height: 12.0
  file: analysis/noise/immission_per_day.avro
  cellSize: 250
  opacity: 0.2
  maxHeight: 20
  colorRamp:
    reverse: false
    ramp: greenRed
    steps: 10
Avro Schema
The Avro schema defines the structure of the data stored in the Avro format. It consists of a record with several fields containing different types of information. Below is an explanation of the key fields:
crs (string): This field stores the Coordinate Reference System (CRS) used for the spatial data.
xCoords (array of floats): A list of X coordinates representing the horizontal positions in a Cartesian coordinate system.
yCoords (array of floats): A list of Y coordinates representing the vertical positions in a Cartesian coordinate system.
timestamps (array of integers): A list of timestamps in seconds. Each timestamp corresponds to an X-Y coordinate pair and represents the time at which the position was recorded.
data (map of arrays of floats): A mapping of keys to arrays of floating-point numbers. This field contains the XYT data, which are coordinates and associated values tied to the timestamps.
This structure is optimized for storing spatio-temporal data, useful for applications such as geospatial data processing or simulations that handle such information.
{
  "type" : "record",
  "name" : "XYTData",
  "namespace" : "org.matsim.application.avro",
  "fields" : [
    {
      "name" : "crs",
      "type" : "string",
      "doc" : "Coordinate reference system"
    },
    {
      "name" : "xCoords",
      "type" : {
        "type" : "array",
        "items" : "float"
      },
      "doc" : "List of x coordinates"
    },
    {
      "name" : "yCoords",
      "type" : {
        "type" : "array",
        "items" : "float"
      },
      "doc" : "List of y coordinates"
    },
    {
      "name" : "timestamps",
      "type" : {
        "type" : "array",
        "items" : "int"
      },
      "doc" : "List of timestamps in seconds"
    },
    {
      "name" : "data",
      "type" : {
        "type" : "map",
        "values" : {
          "type" : "array",
          "items" : "float"
        }
      },
      "doc" : "XYT data"
    }
  ]
}