
Sankey/Alluvial diagrams
 Mode shifts
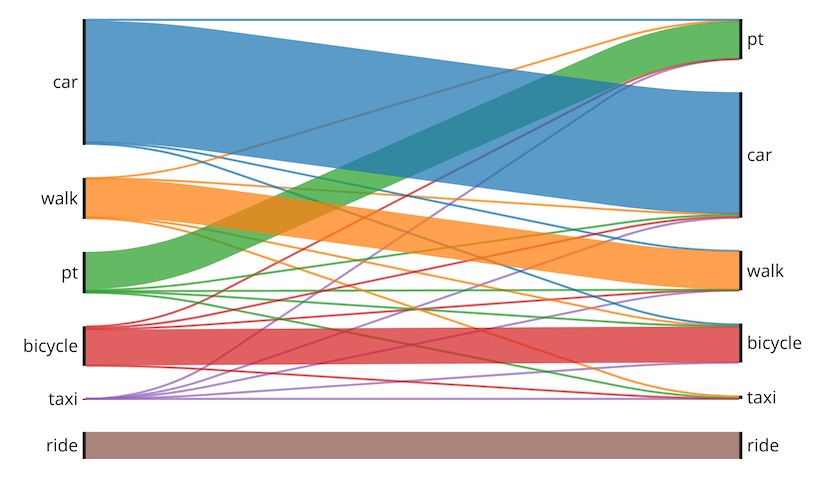
Sankeys are great for showing the shift between two states; for example mode share shift from alt. A to alt. B. You see these a lot in politics after a parliamentary election, to show the change in the number of seats for each party.
Usage
Standalone: a file named sankey-*.yaml must be present in working folder. Each yml file matching that pattern will produce a separate Sankey diagram.
Dashboard: Each panel is defined inside a row in a dashboard-*.yaml file.
- Use panel
type: sankeyin the dashboard configuration.
sankey-example.yaml
# only the csv line is required, but title and description help your viewers
type: sankey
csv: modeshares.csv
title: Sankey Demo
description: Erster Schritt!
sort: true
Sort determines the order of the options displayed in the chart. (Default: true)
- If true (or not present), the available options on both the left and right sides of the chart will be sorted alphabetically.
- If false, then the graph will display elements in the order in which they are found in your dataset. This is useful if e.g. you add a new mode and want it at the top or bottom of the chart, instead of in the middle somewhere based on its name.
Sankey CSV File format
Header line can contain labels but is CURRENTLY IGNORED
- Column 1: 'From' category
- Column 2: 'To' category. These are not required to match the labels in column 1.
- Column 3: Value
- All other columns ignored
Example:
from;to;number of trips (sample size); average change [sec]

car;car;748552;4.851276865
walk;walk;236111;0.064274854
walk;car;1644;-797.9385645
pt;ride;0;0
pt;bicycle;3167;-394.8995895
bicycle;walk;2276;925.78471

ride;bicycle;0;0