Examples
The thumbnails below depict each visualization type that is available in SimWrapper. Click on a thumbnail for the detailed guide on parameters and an explanation of how to include that visualization in your analysis or dashboard.
For general help on getting started with SimWrapper, see the Getting Started Guide.
MATSim visualizations
These visualizations are for MATSim-specific outputs.
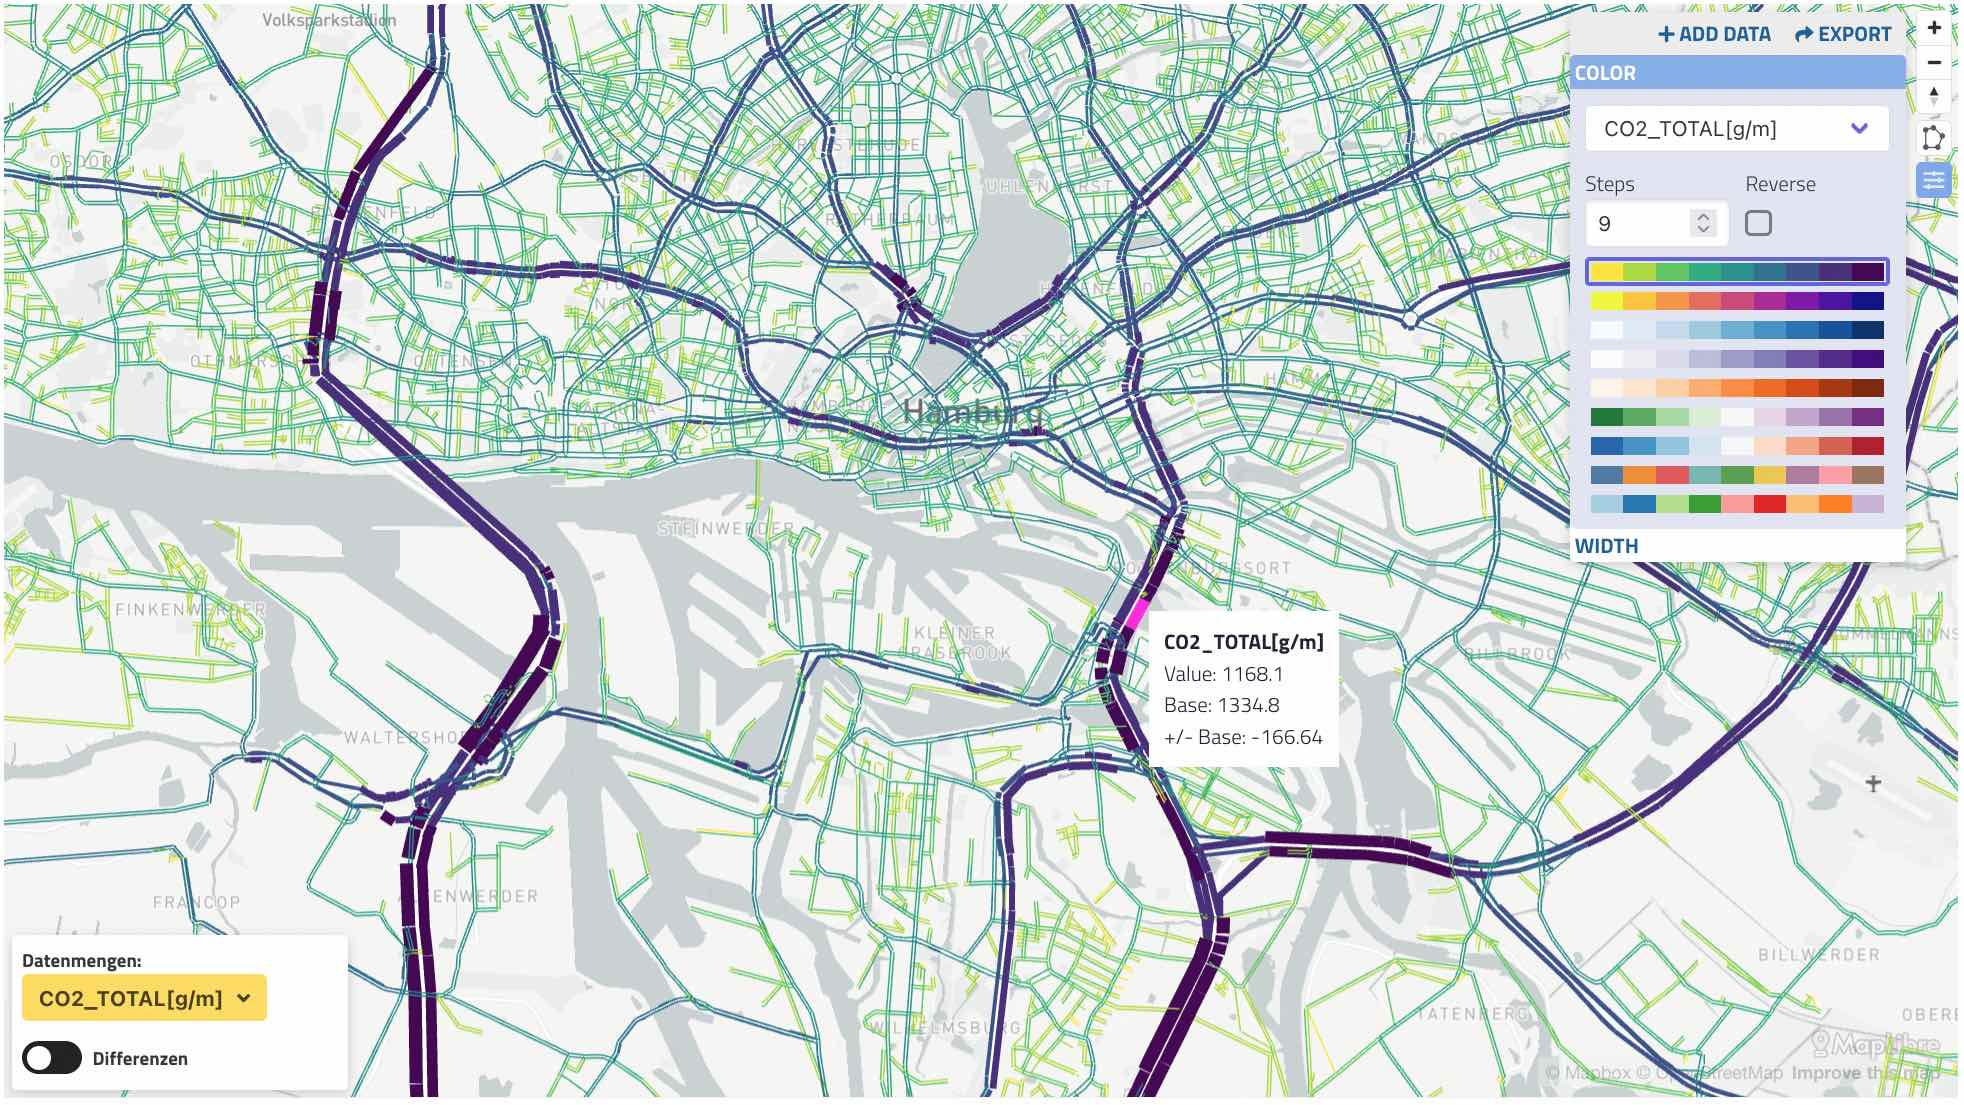
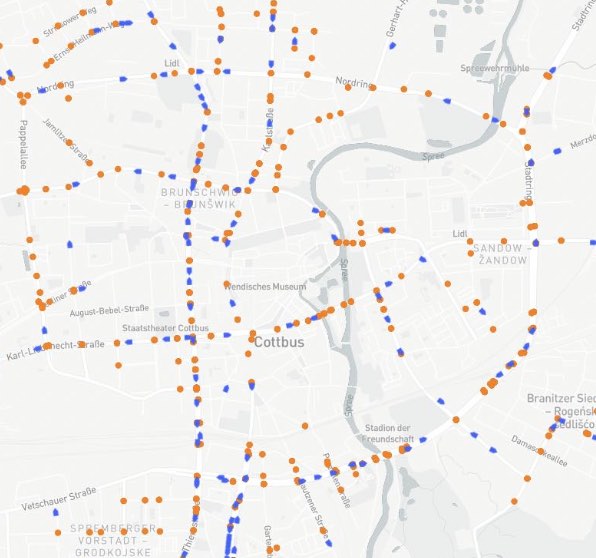
MATSim network link plot
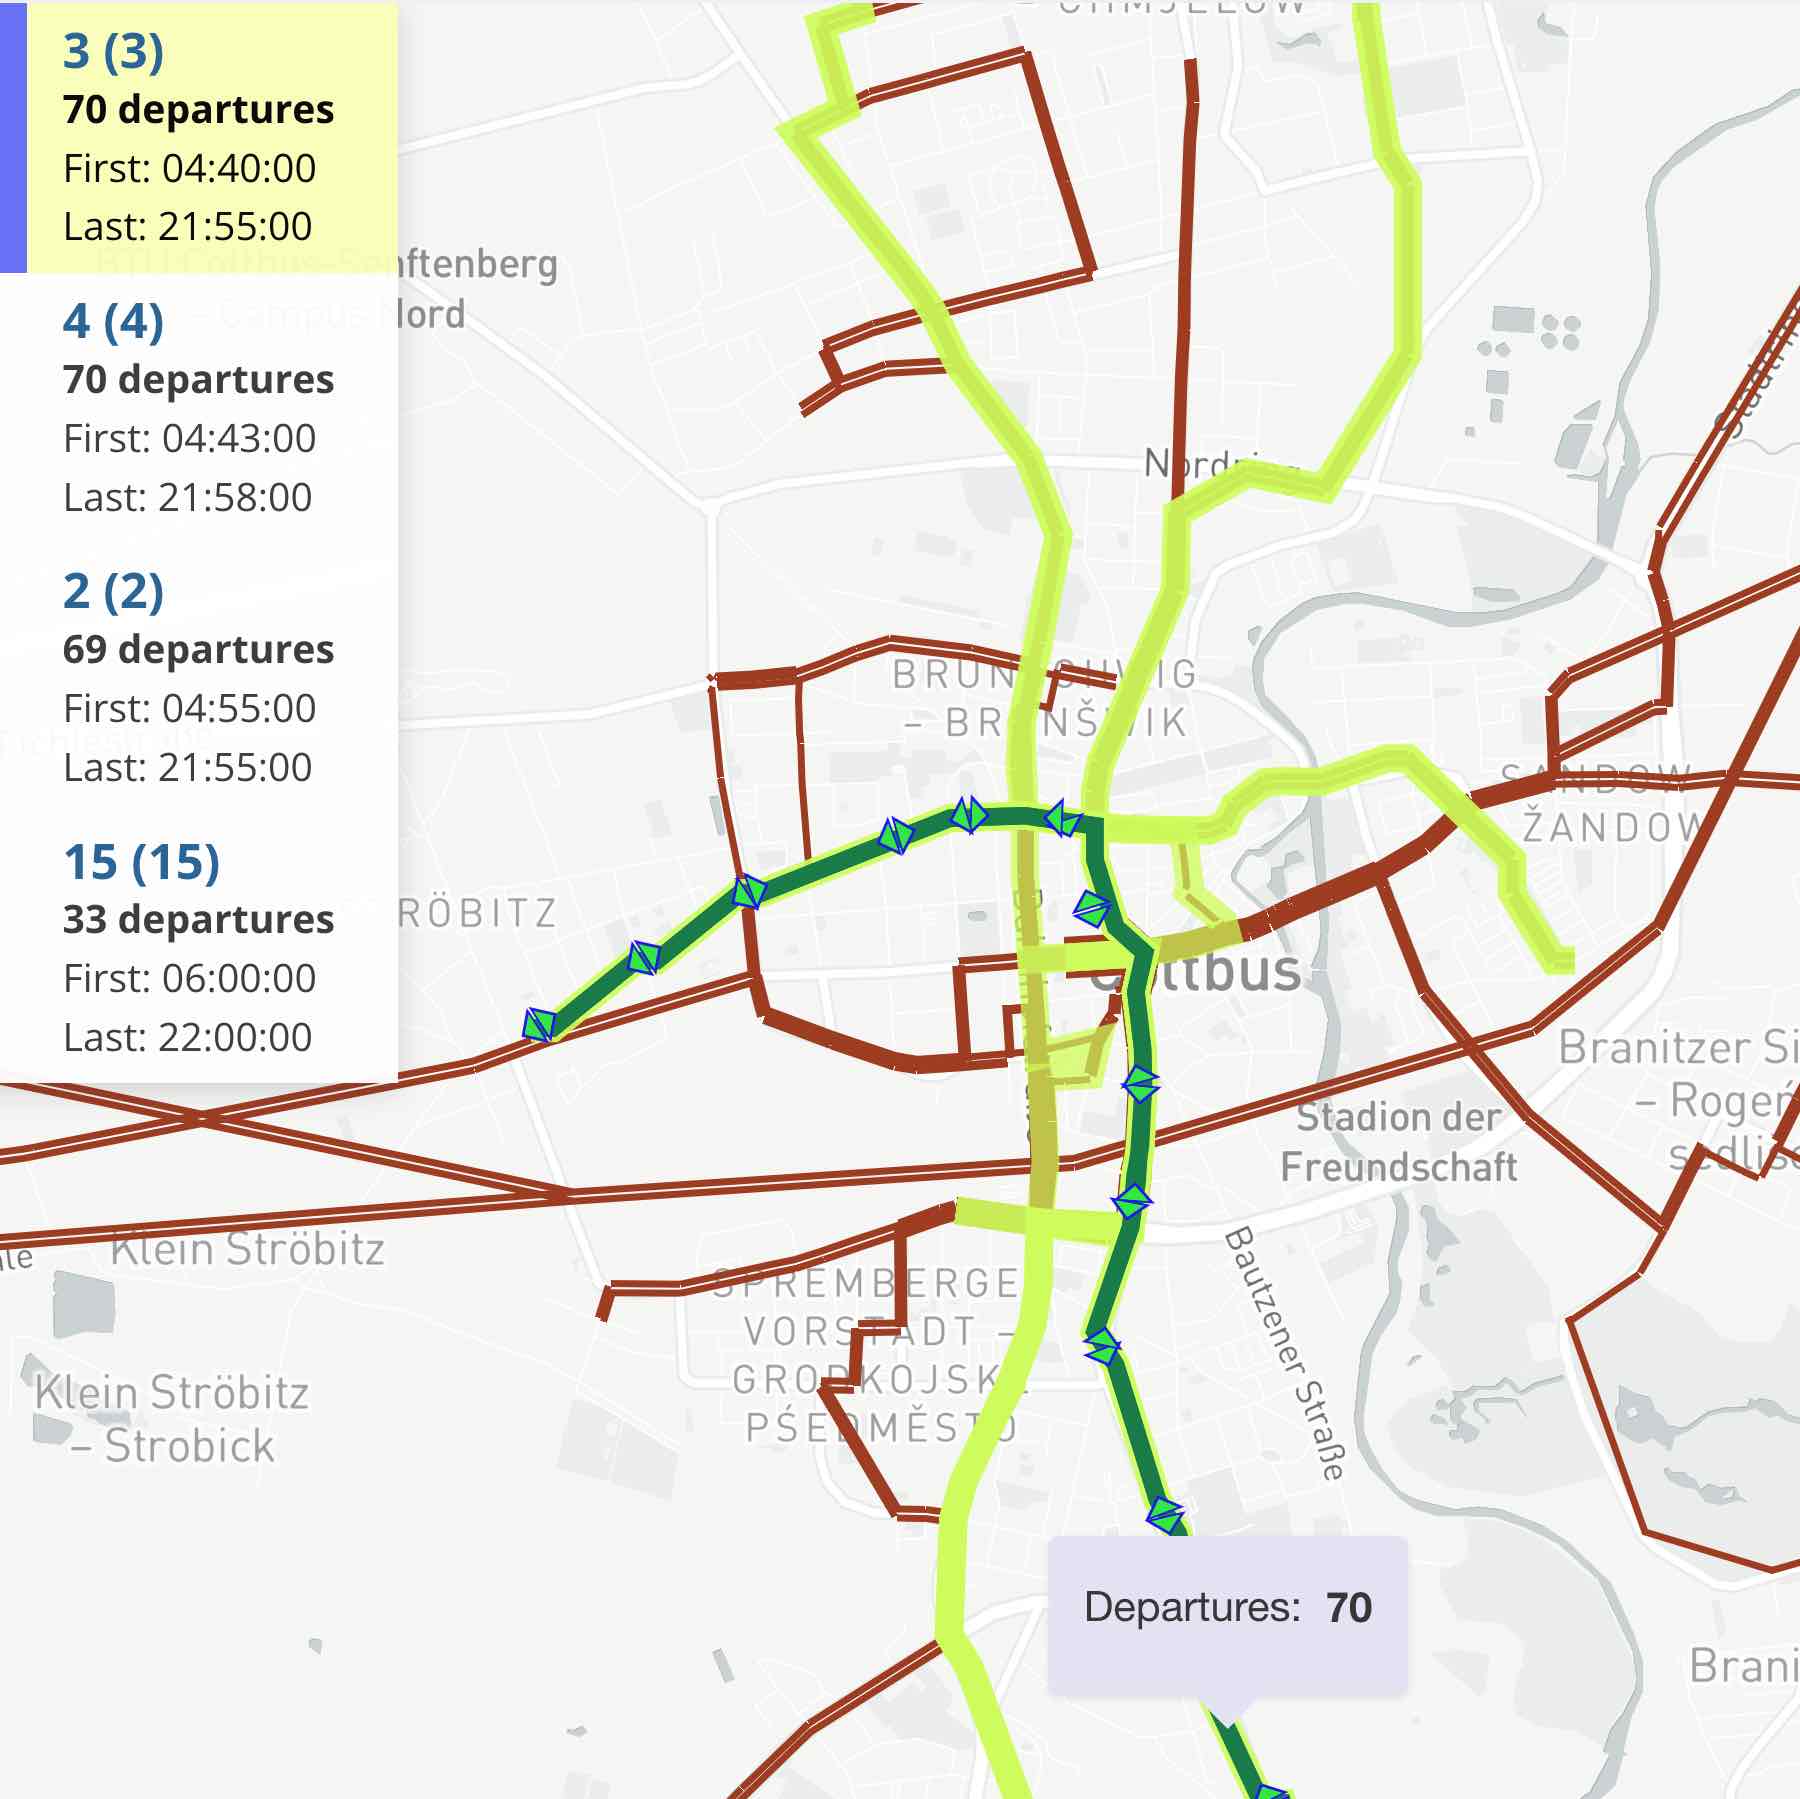
MATSim transit network
MATSim Carriers/Freight

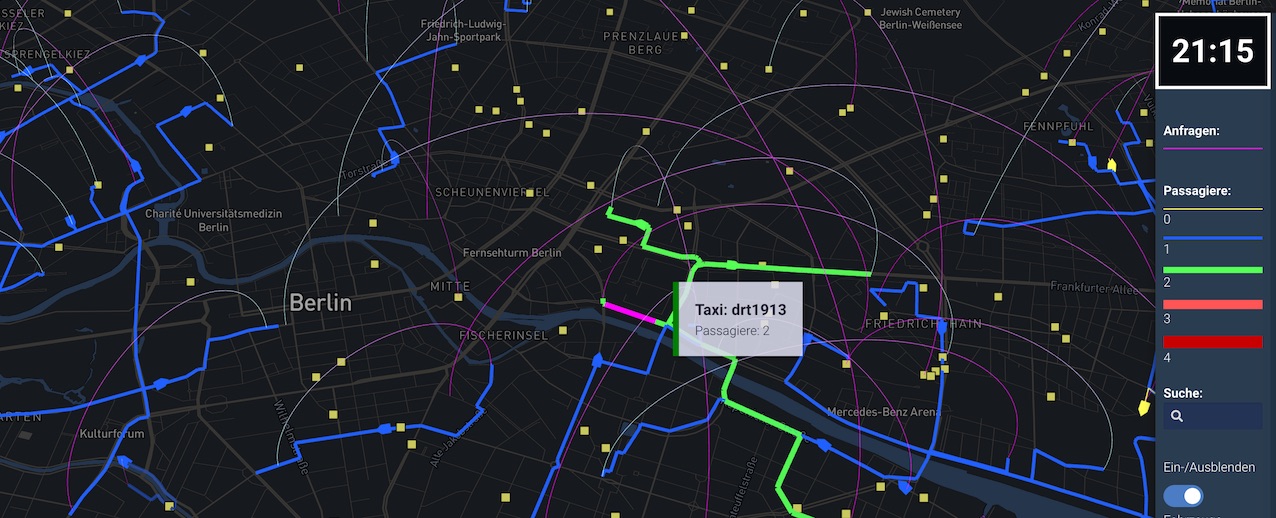
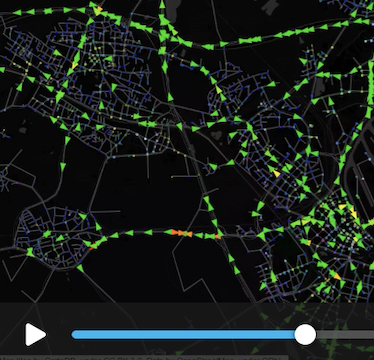
MATSim vehicle animation (DRT)
MATSim Event viewer (experimental)
Statistical charts and maps
These visualizations work with any dataset, generally using CSV text format or XML files.
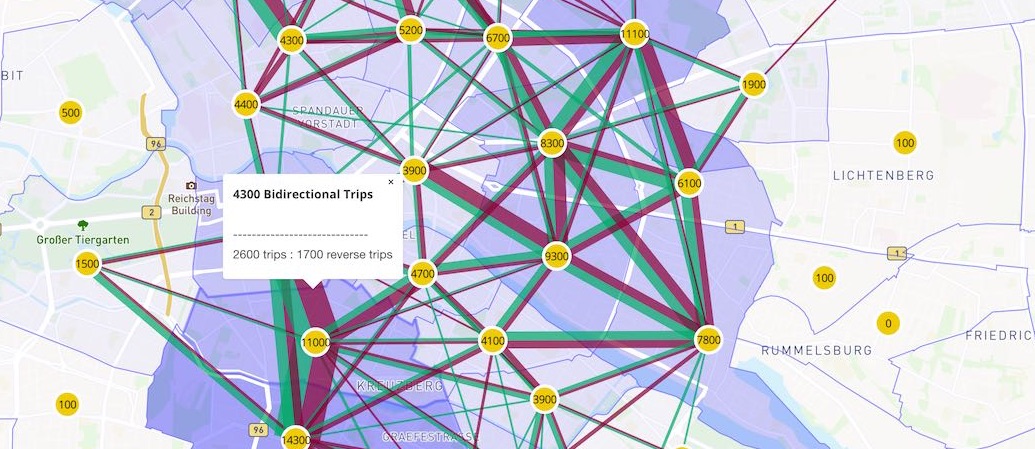
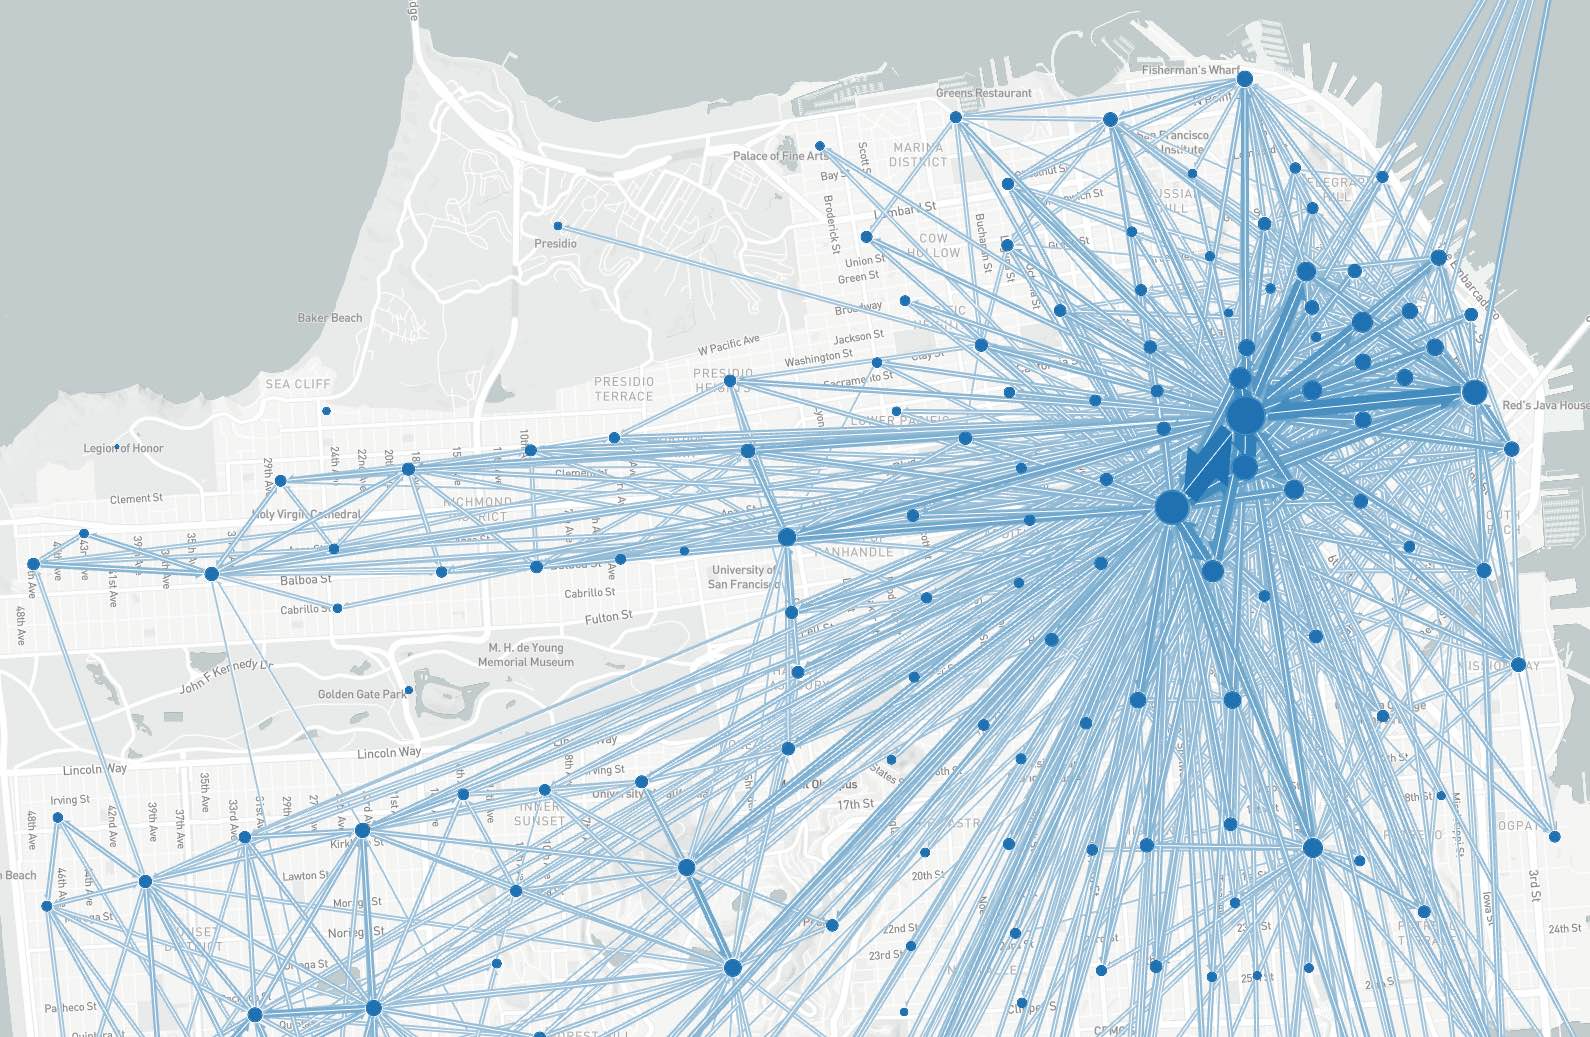
Aggregate O/D flow
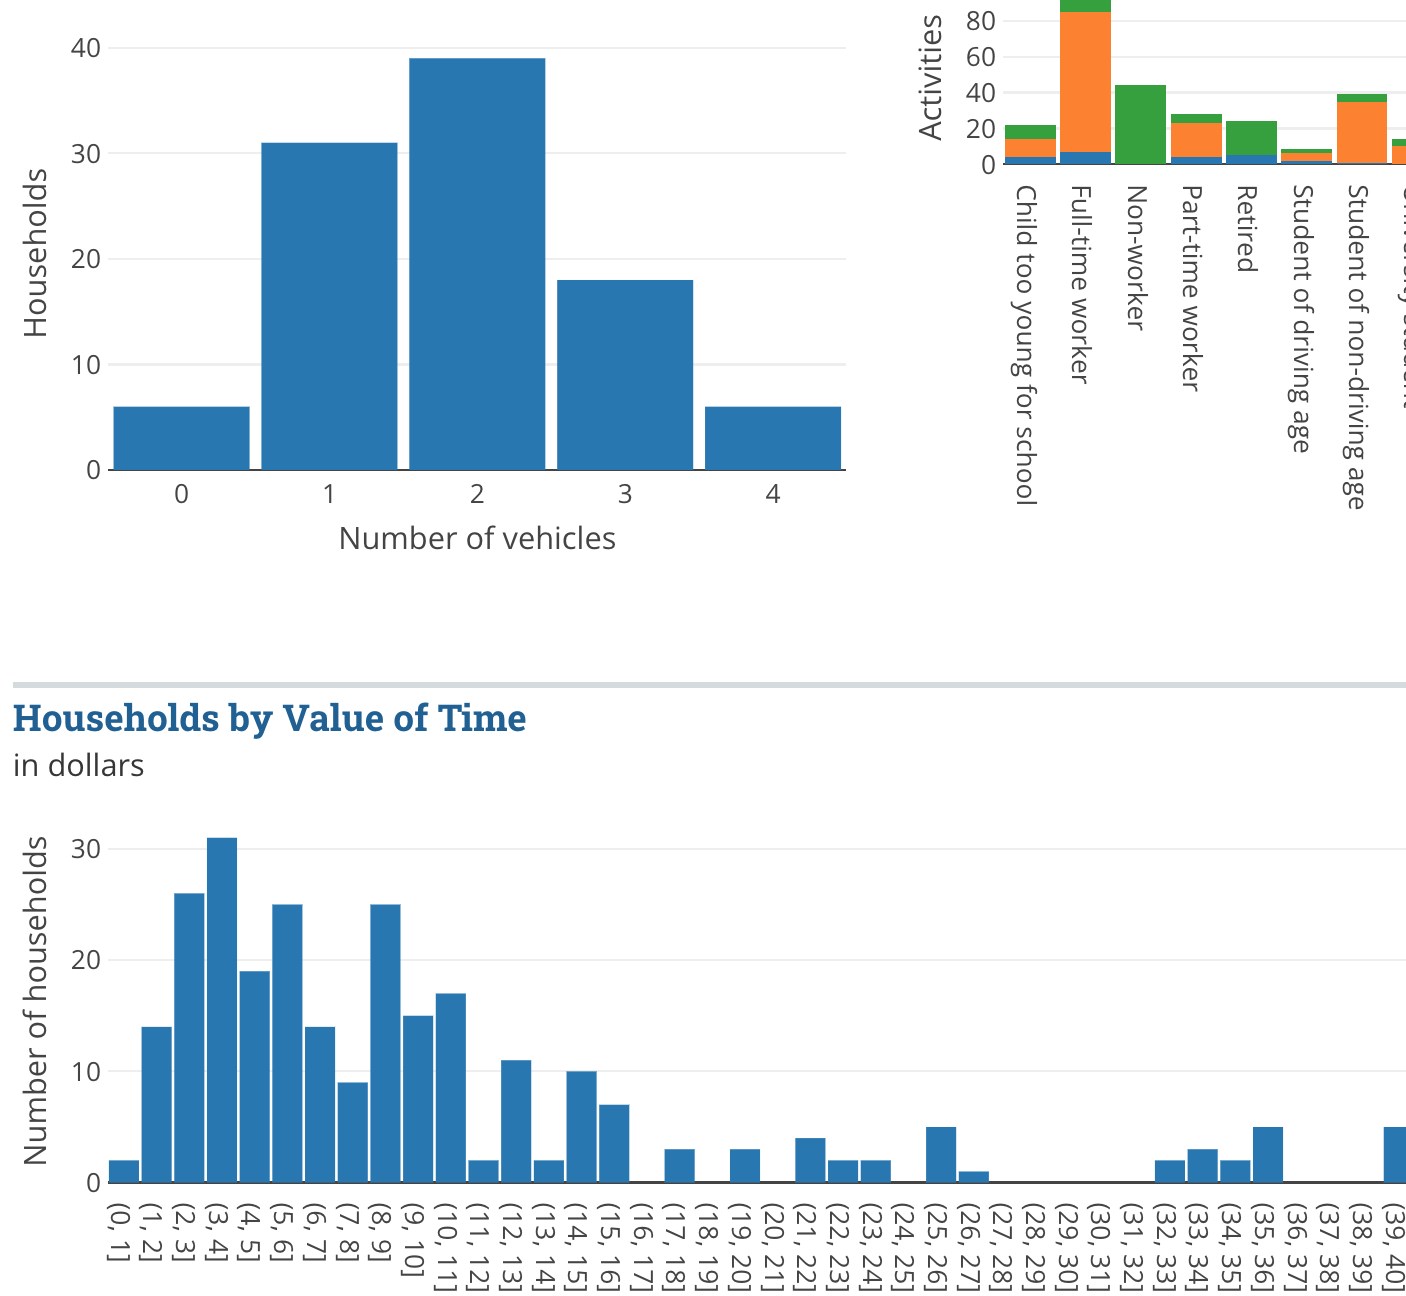
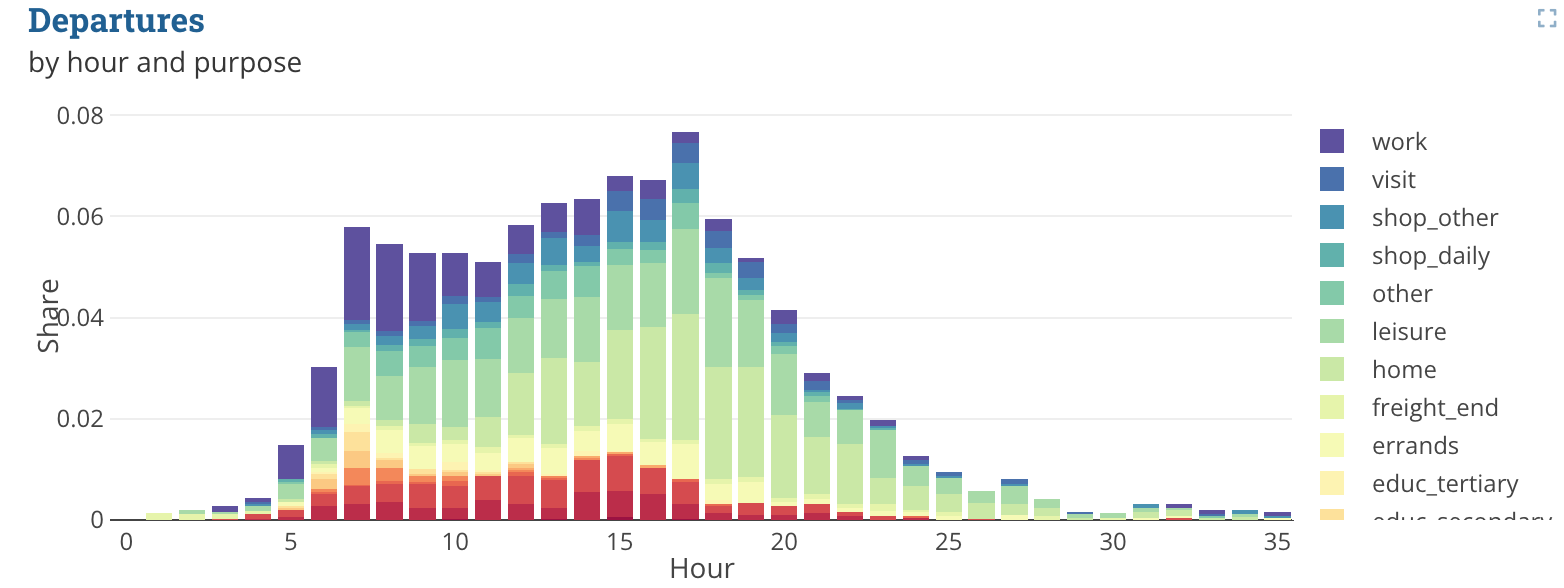
Bar, area, line charts
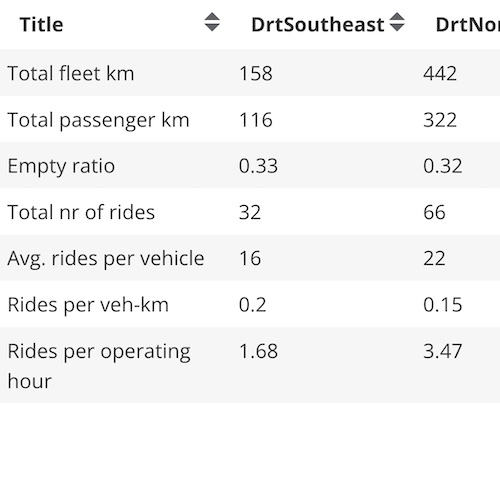
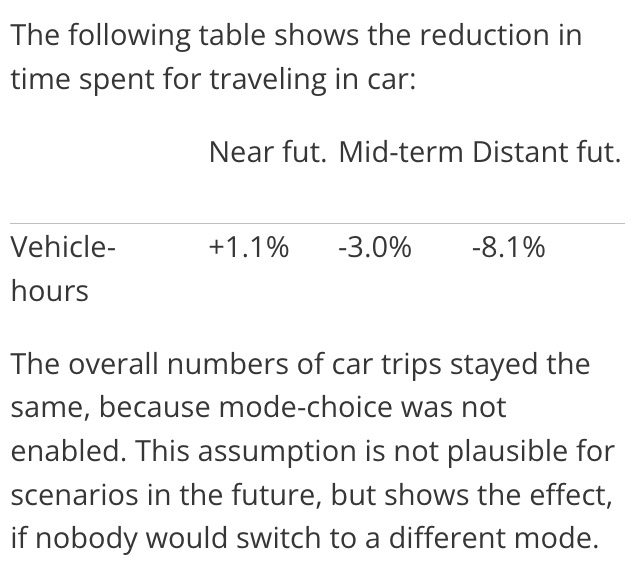
Calculation table
CSV table viewer
Flow map
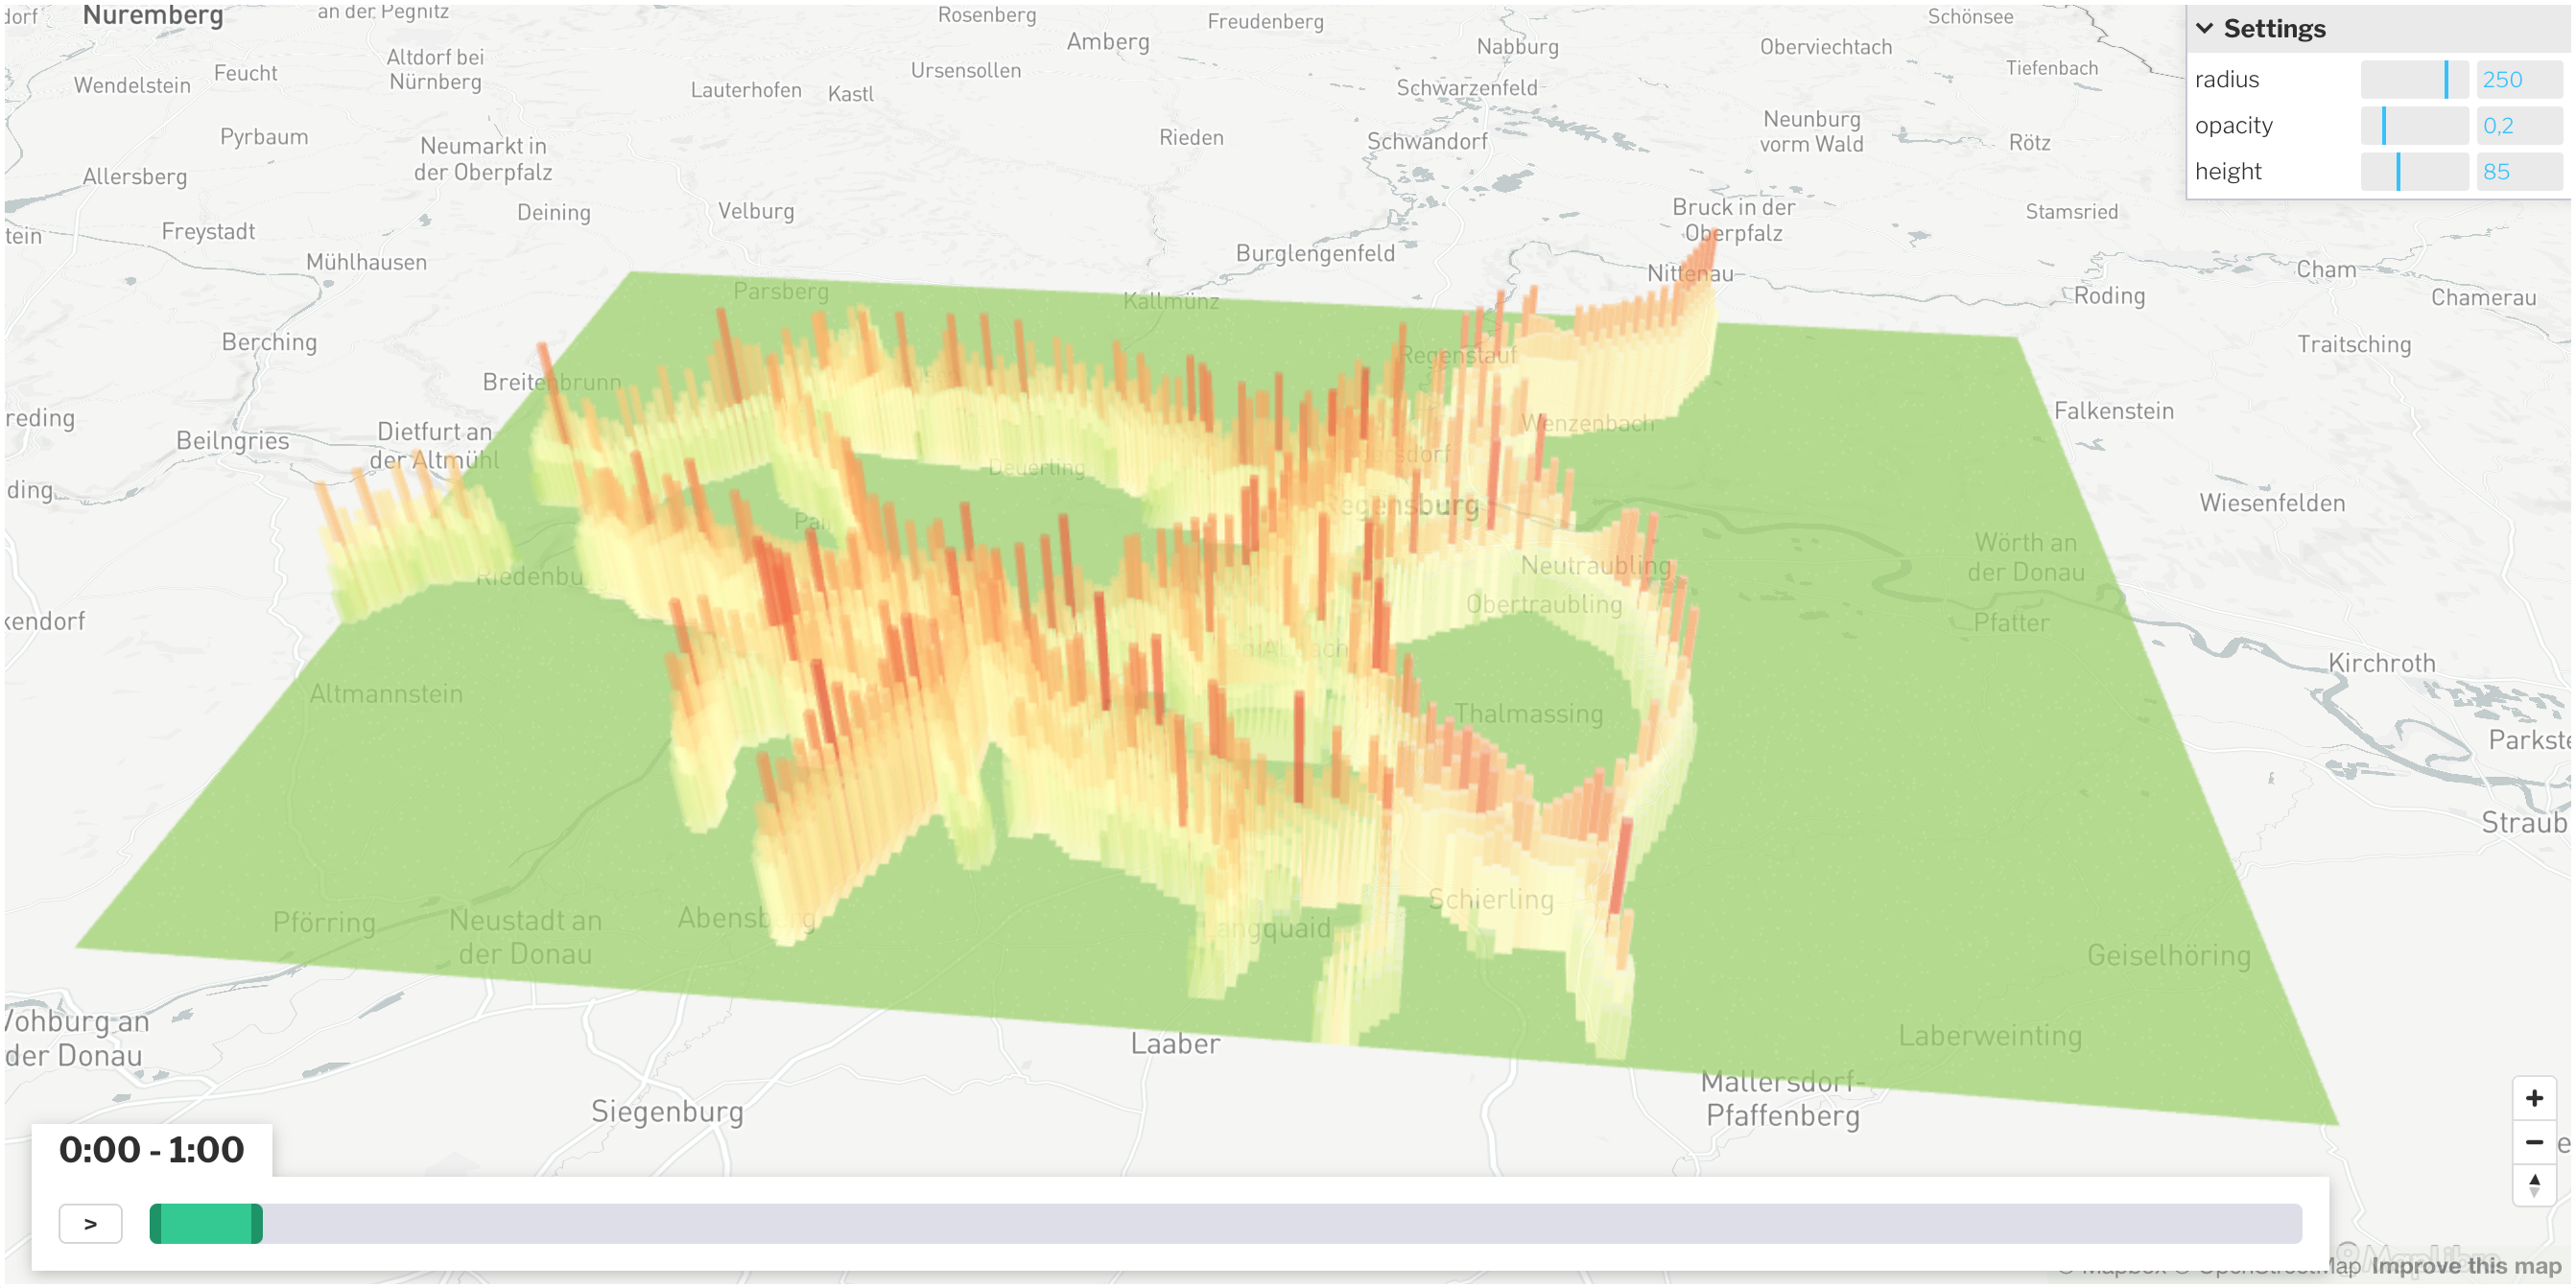
Gridmap
Heat map plot

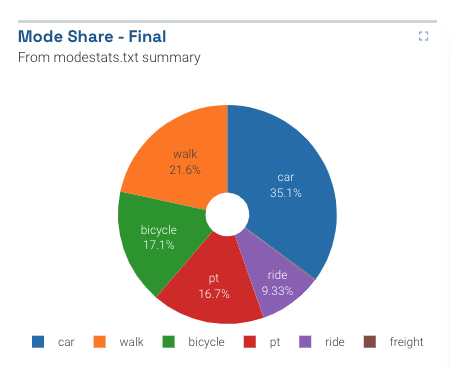
Pie charts
Plotly chart
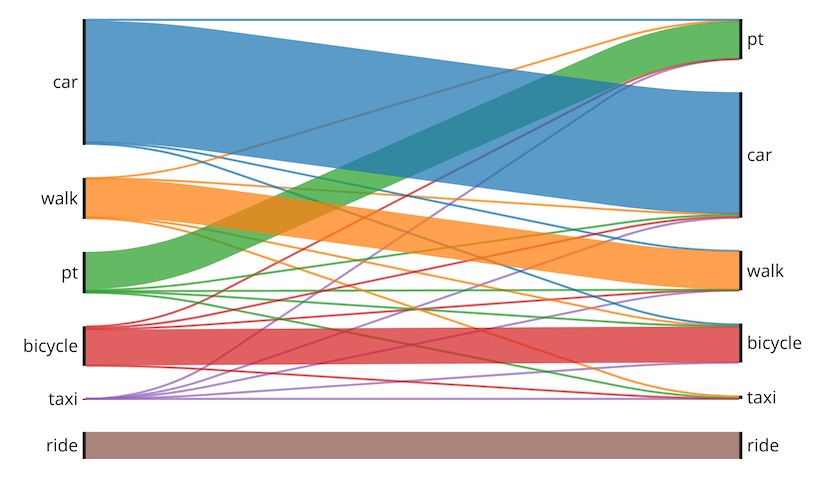
Sankey flow diagram
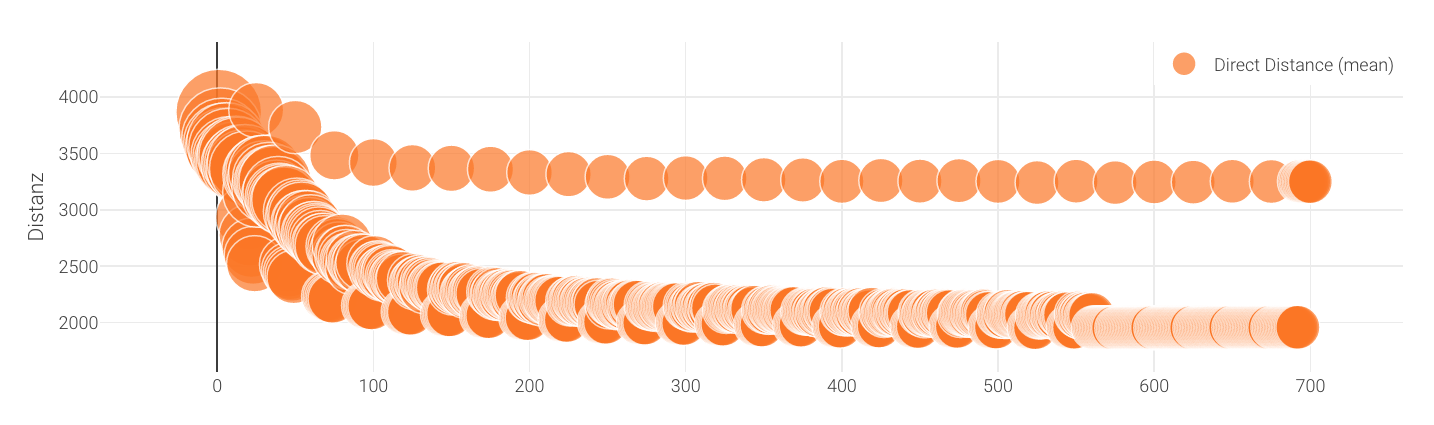
Scatter plots
Shapefiles: area

Shapefiles: networks
Text/Markdown
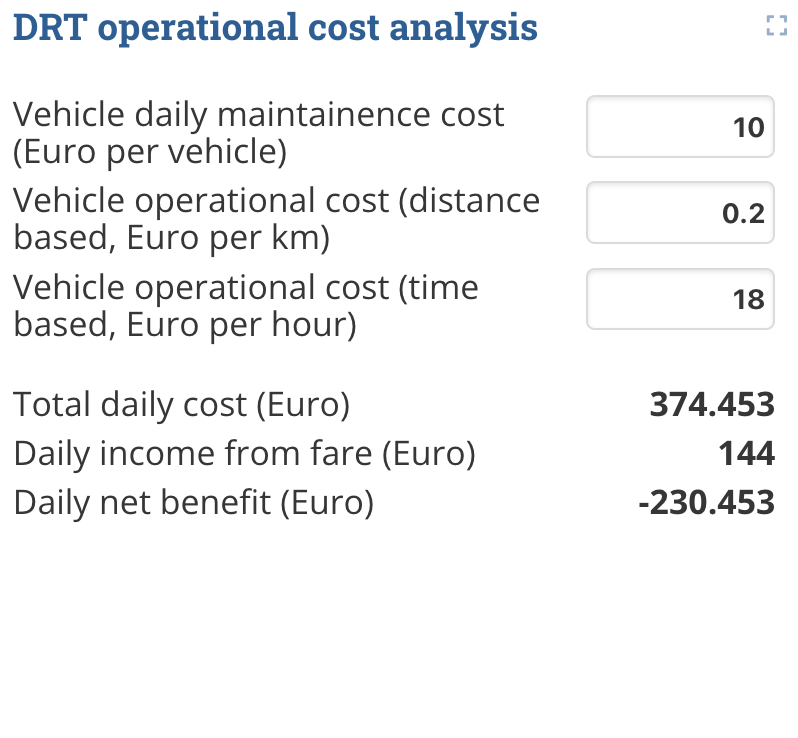
Tiles: single metrics
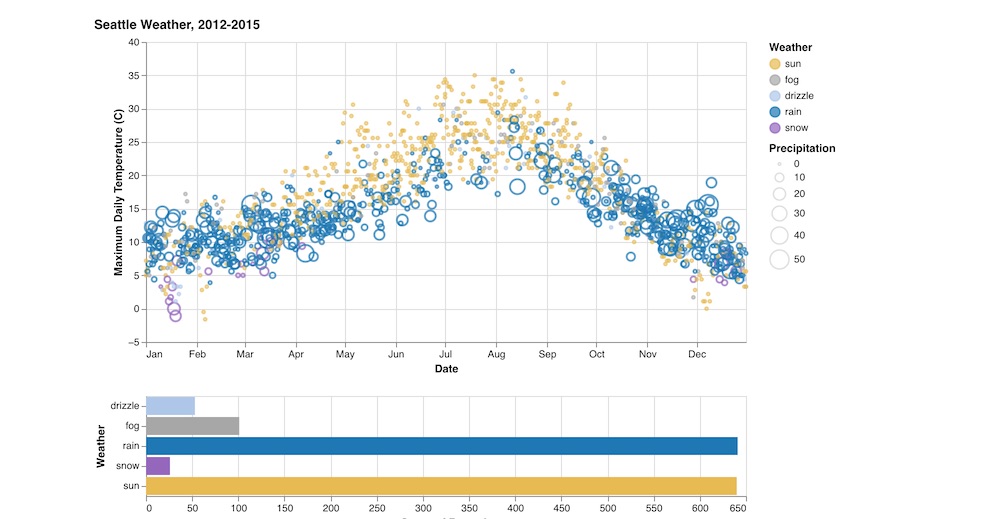
Vega-lite charts
Video player
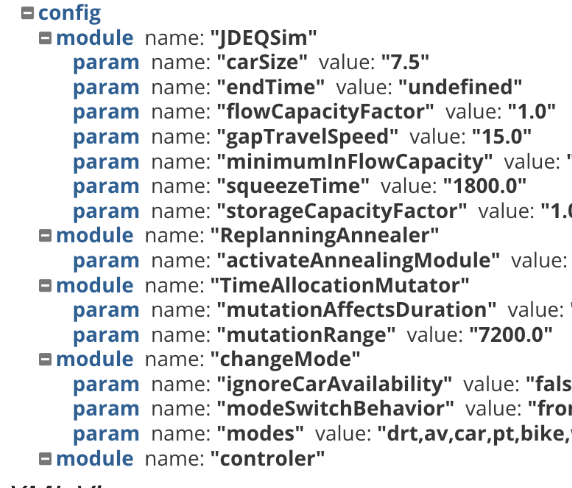
XML Config viewer
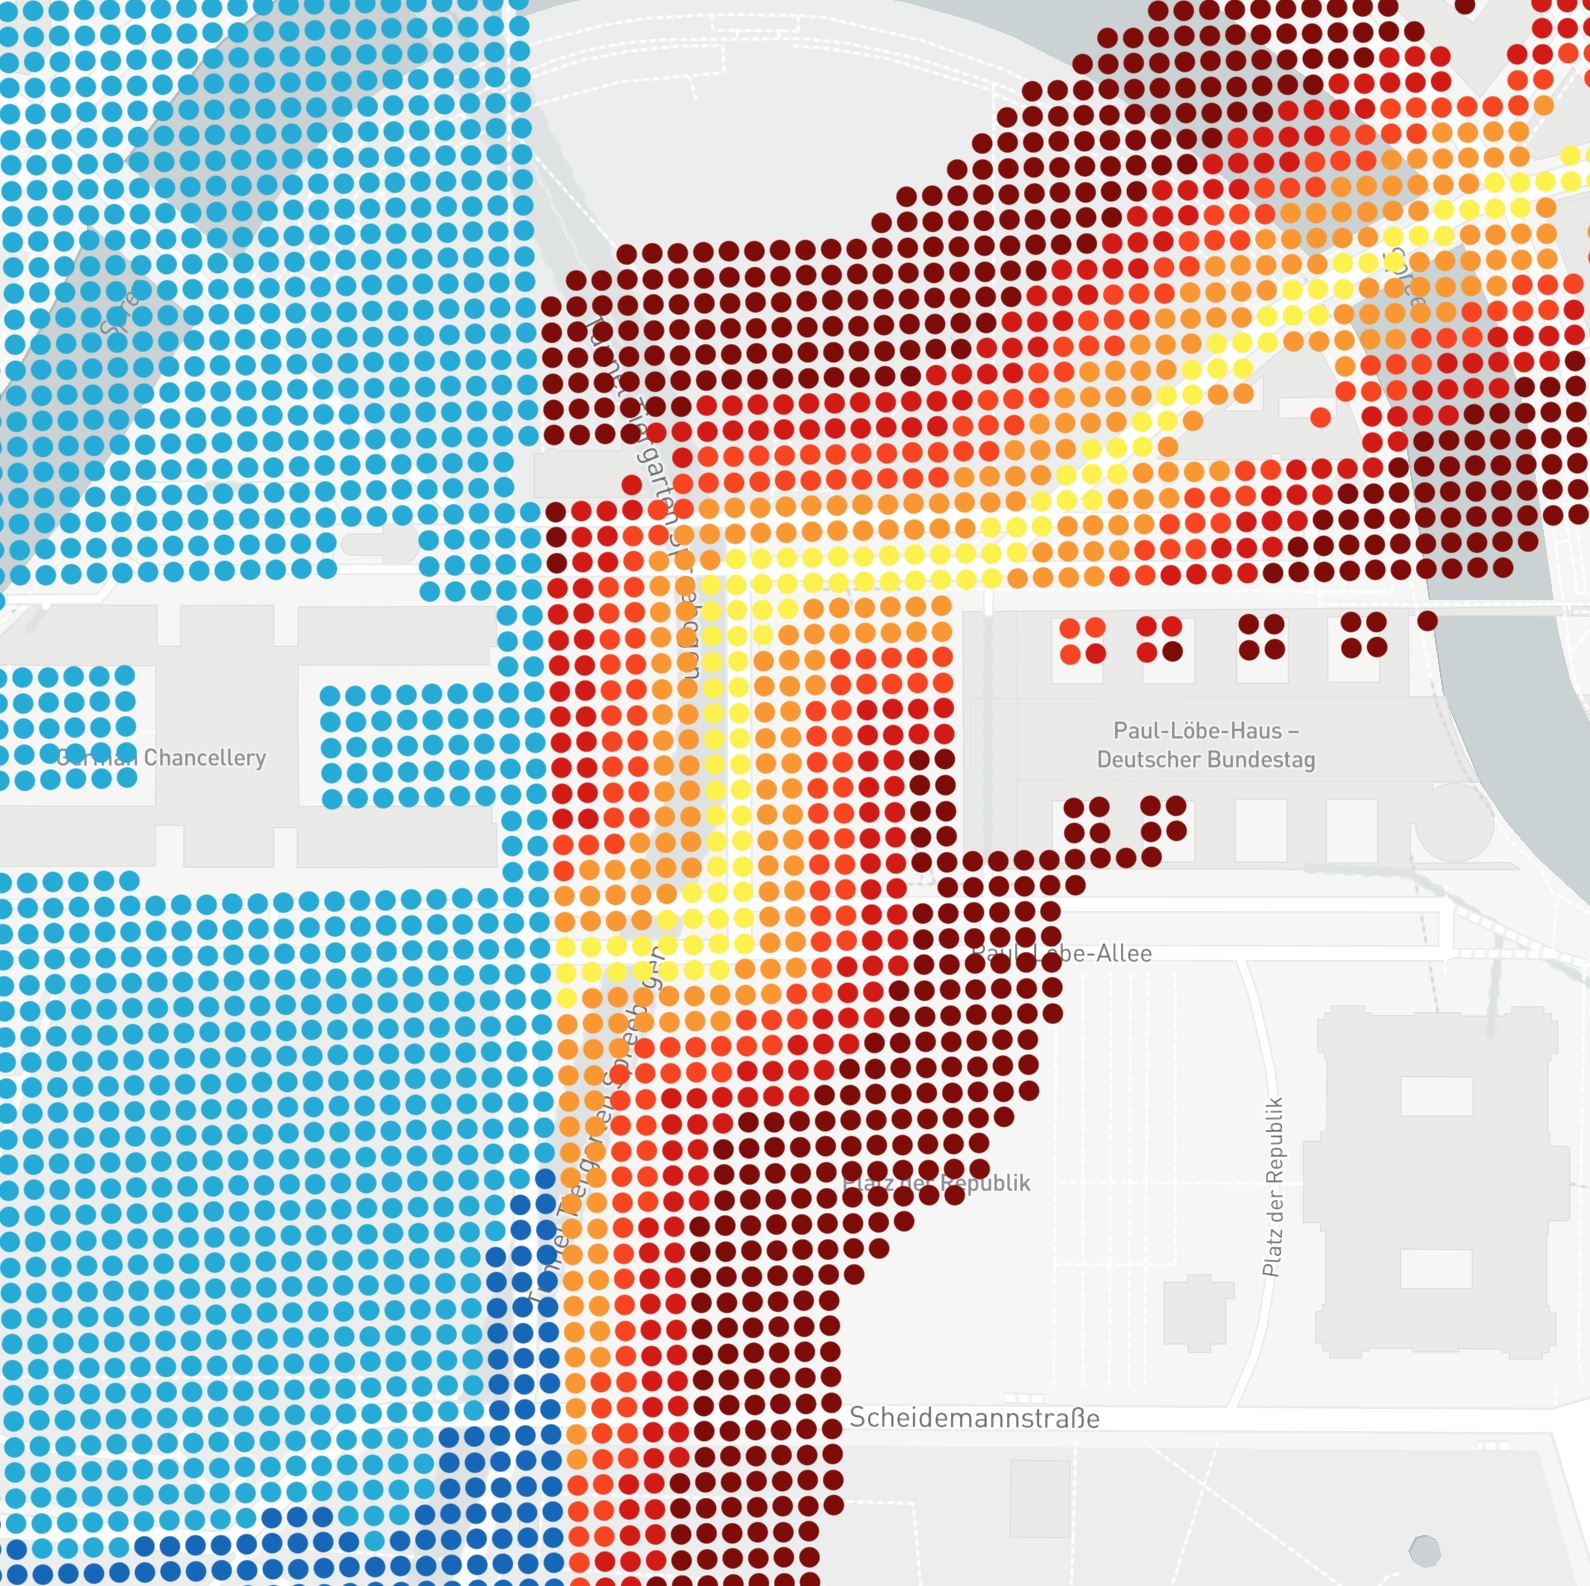
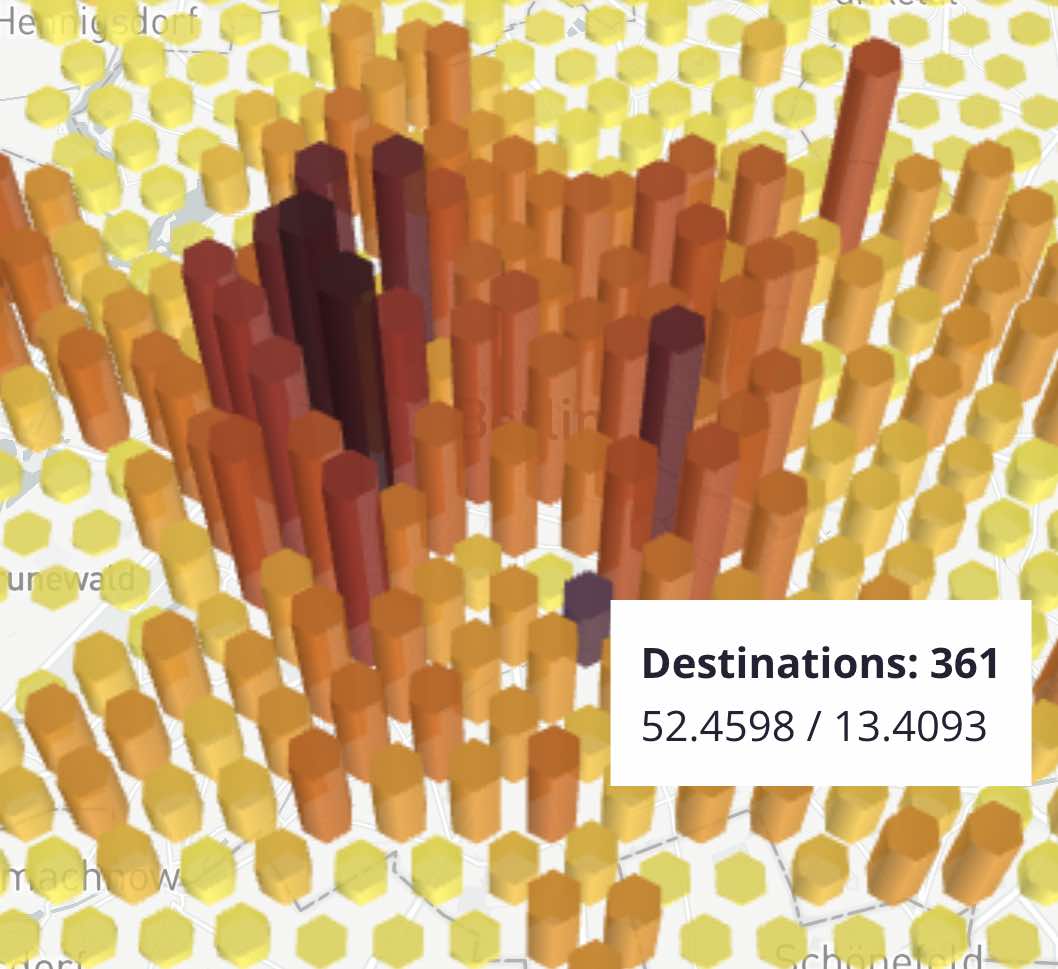
X/Y hexagons
X/Y/Time point data