
AequilibraE Map
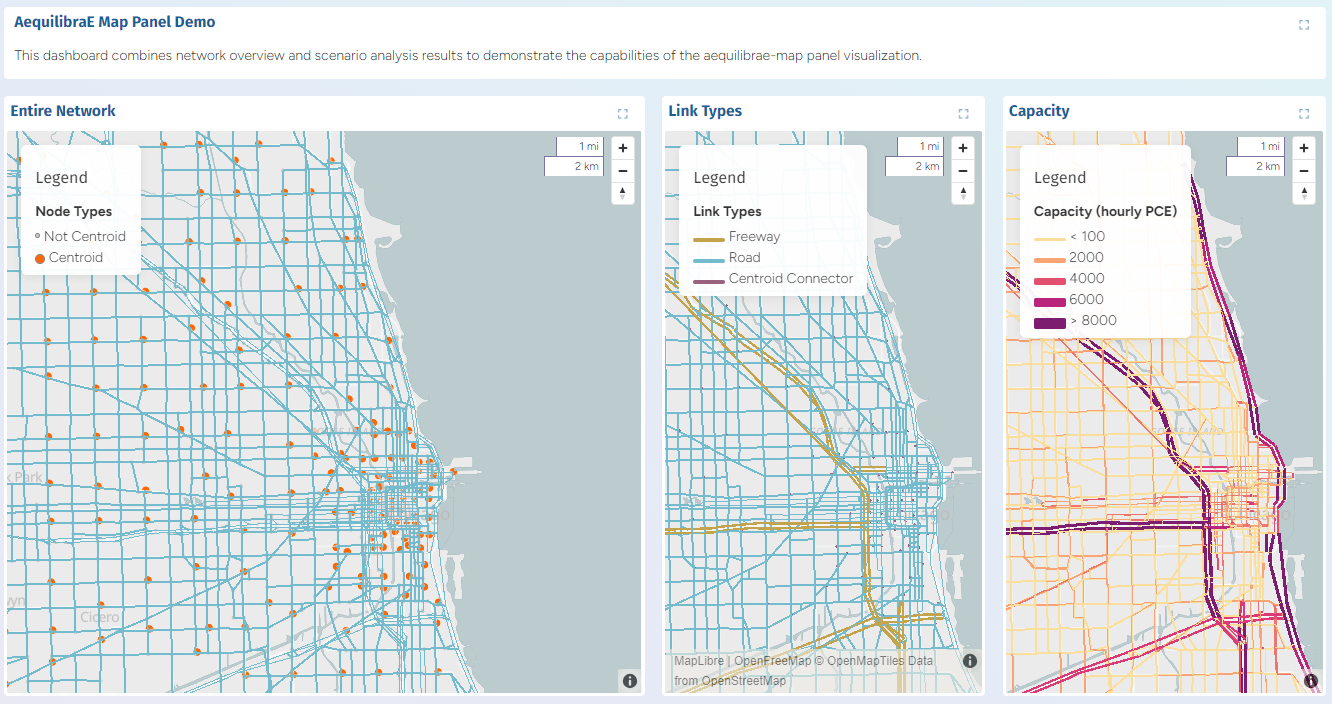 Maps showing AequilibraE network plots in Chicago, IL
Overview
The AequilibraE Map plugin displays geometries (points, lines, polygons) stored in an AequilibraE project SQLite database and allows styling using model and result attributes. Panels using this plugin are added inside dashboard YAML files; use type: aequilibrae for the panel.
Usage
- Add the panel to a dashboard row in a
dashboard-*.yamlfile usingtype: aequilibrae. - The panel accepts either a direct
configobject from code or a path to a YAML visualization config viayamlConfig(parsed by the plugin). - Use
extraDatabaseswhen you need to join attributes from other SQLite files (e.g. a results DB).
Properties
This section describes top-level panel properties and layer configuration. Fields are split into Required and Optional where appropriate.
Dashboard panel properties
| Property | Usage |
|---|---|
type | MUST be set to aequilibrae in dashboard-*.yaml files |
title | Panel title shown above the map |
height | Relative height of the panel (default depends on layout) |
width | Relative width of the panel |
Required top-level properties
| Property | Type | Description |
|---|---|---|
database | string | Path to the main AequilibraE SQLite database (e.g. project_database.sqlite). In YAML visualizations this may be provided as database or file (both accepted). |
Optional top-level properties
| Property | Type | Description |
|---|---|---|
extraDatabases | map<string,string> | Named map of additional SQLite DBs used for joins. Example: results: results_database.sqlite |
center | array or string | Map center as [lon, lat] or a string interpreted by the frontend. If omitted the viewer will compute a suitable center. |
zoom | number | Initial zoom level |
projection | string | Coordinate reference system, e.g. "EPSG:32719" |
bearing | number | Map rotation |
pitch | number | Map pitch |
defaults | object | Default style values applied to all layers (see below) |
legend | array | Explicit legend items (array of { label, color, size, shape, subtitle }) |
minimalProperties | boolean | If true request a smaller set of feature properties to reduce payload |
geometryLimit | number | Limit number of geometries loaded (useful for very large DBs) |
Layer definitions (layers)
Layers are defined under the layers: map. Each key is a layer id and contains configuration for a set of features.
Supported layer fields:
table(string) — table name in the SQLite DB containing geometry and attributes.geometry(string) — one ofpoint,line, orpolygon.sqlFilter(string, optional) — SQL WHERE clause to filter rows, e.g."is_centroid=1".join(object, optional) — join config to attach attributes from another table (see Joins).style(object) — visual style settings (see Layer styles below).
Example minimal layer:
layers:
  links:
    table: links
    geometry: line
    style:
      lineColor: "#74BBCD"
      lineWidth: 0.5
Joins & extraDatabases
Provide additional databases at the top level using extraDatabases:
extraDatabases:
  results: results_database.sqlite
Then in the geometry layer, reference the named database in a layer join to attach attributes from another table:
join:
  database: results      # matches a key specified in extraDatabases
  table: base_case       # table of the database to join
  leftKey: link_id       # geometry database ("project_database.sqlite", typically)
  rightKey: link_id      # joined database table
  type: left             # optional: 'left' (default) or 'inner'
After the join, columns from the joined table are available for styling (e.g. quantitative palettes using a result column).
Layer styles
Style keys supported: fillColor, lineColor, lineWidth, pointRadius, fillHeight. (Note: client-side include/exclude filters were removed — use sqlFilter on the layer instead.)
Default Styles (defaults)
The optional defaults object sets baseline style values applied to all features before layer-specific styles are applied. If a layer doesn't specify a particular style property, the default value is used.
Supported properties in defaults:
| Property | Type | Description | Default if omitted |
|---|---|---|---|
fillColor | string | Default fill color for polygons and points (hex) | "#59a14f" |
lineColor | string | Default line color (hex) | "#4e79a7" |
lineWidth | number | Default line width in meters | 2 |
pointRadius | number | Default point radius in meters | 4 |
fillHeight | number | Default height for 3D extrusion | 0 |
Example:
defaults:
  fillColor: "#6f6f6f"
  lineColor: "#FF6600"
  lineWidth: 2
  pointRadius: 4
Colors (fillColor, lineColor)
Colors may be specified in three ways:
- Static hex string:
"#FF6600" - Categorical mapping:
fillColor:
  column: is_centroid
  colors:
    1: "#FF6600"
    0: "#cacaca"
- Quantitative mapping (palette):
lineColor:
  column: Delay_factor_Max
  palette: Temps
  dataRange: [1,3]
Fields supported for quantitative mapping: column, palette, numColors, range, dataRange.
Palettes are provided by CARTOColor.
Geometry sizes (lineWidth, pointRadius)
Geometry sizes can be defined in a few ways,
- a static number:
2 - a categorical mapping:
lineWidth:
  column: link_type
  widths:
    road: 20
    freeway: 80
    centroid_connector: 20
- or a continuous mapping:
pointRadius:
  column: some_metric
  dataRange: [0, 100]      # optional: clamp the input data range
  widthRange: [1, 50]      # optional: set the output data range to map to
Filtering features
Use SQL-level filtering — sqlFilter on the layer — to restrict rows returned by the database. This prevents unwanted geometries (for example centroids) from being loaded into memory and rendered, and is the supported method for filtering.
Example: to exclude centroid nodes:
layers:
  nodes:
    table: nodes
    geometry: point
    sqlFilter: "is_centroid = 0"  # only non-centroid nodes
Legend
- Legends are auto-generated from categorical/color/width mappings where possible.
- You can provide an explicit
legendarray at the panel level to control labels/colors/sizes manually. Each legend item may includelabel,color,size,shape,subtitle.
Example explicit legend:
legend:
  - subtitle: "Link Types"
  - label: "Freeway"
    color: "#C3A34B"
    size: 4
    shape: line
Examples
Examples below are taken from the Chicago sample dashboards in this repository.
Simple entire network
- type: aequilibrae
  title: "Entire Network"
  database: project_database.sqlite
  center: [-87.6298, 41.8781]
  zoom: 10
  defaults:
    fillColor: "#6f6f6f"
    lineColor: "#FF6600"
    lineWidth: 2
    pointRadius: 4
  layers:
    nodes:
      table: nodes
      geometry: point
      sqlFilter: "is_centroid = 0"  # show only non-centroid nodes
      style:
        fillColor:
          column: is_centroid
          colors:
            1: "#FF6600"
            0: "#cacaca"
    links:
      table: links
      geometry: line
      style:
        lineColor: "#74BBCD"
        lineWidth: 0.5
Join with results DB and palette mapping
- type: aequilibrae
  title: "Delay Factor"
  database: project_database.sqlite
  extraDatabases:
    results: results_database.sqlite
  defaults:
    lineWidth: 4
  layers:
    links:
      table: links
      geometry: line
      join:
        database: results
        table: base_case
        leftKey: link_id
        rightKey: link_id
        type: left
      style:
        lineColor:
          column: Delay_factor_Max
          palette: Temps
          dataRange: [1,3]
        lineWidth:
          column: link_type
          widths:
            3: 20
            2: 40
            1: 20
Tips & Notes
- Use
sqlFilterto reduce the number of features rendered and improve performance. - For very large datasets, set
geometryLimitorminimalPropertiesto reduce memory and payload size.